

Fast
Captures rapid market movements and short-term momentum shifts.
WaveTrend 4D represents the evolution of momentum analysis, building upon decades of digital signal processing research. At its foundation lies John F. Ehlers’ Elegant Oscillator, which revolutionised technical analysis by applying rigorous signal processing principles to financial markets. J. Dehorty’s WaveTrend 3D then applied this foundation to create a beautiful multidimensional indicator.
Our WaveTrend 4D advances this lineage through proprietary signal generation methodologies — the Gradient Divergence Measure (GDM) and Quantile Median Crosses (QMC) — that transform divergence detection into quantitative science.
As a Signal Provider, WaveTrend 4D is a foundational component in the GYTS TradingVSuite. It analyses market data to generate high-quality trading signals, which are then passed to the Flux Composer for aggregation execution.
Hover over components to see details. Lines indicate data flow between components.
WaveTrend is fundamentally a momentum oscillator that normalises price derivatives through hyperbolic tangent transformations and dual-pole filtering . The usual WaveTrend-like oscillators often use multiple moving averages in conjunction, that stack lag upon lag with poor smoothing characteristics. John Ehlers’ advanced computations capture the velocity and acceleration of market movements with both better smoothing and less lag, revealing momentum shifts before they become apparent in price. The “wave” aspect refers to how the normalised derivatives create wave-like patterns that oscillate around zero, whilst “trend” indicates the oscillator’s ability to identify directional bias within these waves.
While both John Ehlers’ Elegant Oscillator core and J. Dehorty’s WaveTrend 3D’s beautiful visualisation are foundational to WaveTrend 4D, our implementation introduces key innovations that elevate its analytical capabilities and make the indicator truly actionable for traders.
WaveTrend 4D introduces two proprietary methodologies for generating high-quality trading signals: the Gradient Divergence Measure (GDM) and Quantile Median Crosses (QMC). These innovations transform subjective pattern recognition into a quantitative, evidence-based process.
Here’s the detailed technical breakdown:
Input Data Processing:
Four-Frequency Generation:
GDM Engine - Six-Factor Analysis:
QMC Engine - Statistical Process:
Signal Output Streams:
The name “WaveTrend 4D” derives from its use of four distinct frequencies, each representing a different temporal perspective:
Fast
Captures rapid market movements and short-term momentum shifts.
Normal
Balances responsiveness with stability for a standard market view.
Slow
Filters out market noise to identify more significant, underlying trends.
Lethargic
Provides a deep, structural view of the market, focusing on long-term cycles.
GDM (often denoted by ”💥” — an explosion of significant reversal) moves beyond simple divergence detection by quantifying the strength of a divergence. Instead of a binary “yes” or “no”, it produces a continuous value that reflects the conviction behind a potential market turn. This is achieved by synthesising six distinct factors into a single, comprehensive score.
GDM’s Six-Factor Formula:
WaveTrend 4D offers six GDM profiles optimised for different trading styles:
| Profile | Primary Focus | Ideal Use Case |
|---|---|---|
| Balanced | General assessment | All-purpose analysis |
| Regular Divergence | Price action | Classic divergence patterns |
| WaveTrend Focus | Oscillator behaviour | Indicator-centric strategies |
| Short-term Waves | Slope emphasis | Scalping and day trading |
| Long-term Waves | Duration focus | Swing and position trading |
| Overbought/Oversold | Absolute value | Mean reversion strategies |
GDM Signal Representation:
QMC (often denoted by ”🌗” — a “quantile” of the area of the moon) identifies reversals after significant trends by calculating the integral of momentum between median crosses. Rather than signalling every crossing, QMC waits for the market’s most profound statements—those rare moments when sustained momentum finally yields to exhaustion.
QMC Process:
Integral Calculation
Quantile Analysis
Reversal Detection
QMC Sensitivity:
| Setting | Signal Frequency |
|---|---|
| Very Low | Rare signals |
| Low | Selective signals |
| Medium | Balanced (default) |
| High | Frequent signals |
| Very High | Many signals |
Note that the sensitivity controls how responsive the detector is to momentum changes — higher sensitivity detects more subtle movements and produces more frequent signals.
Understanding how WaveTrend 4D signals manifest in real market conditions is essential for practical application. Let’s examine three distinct scenarios across different markets:
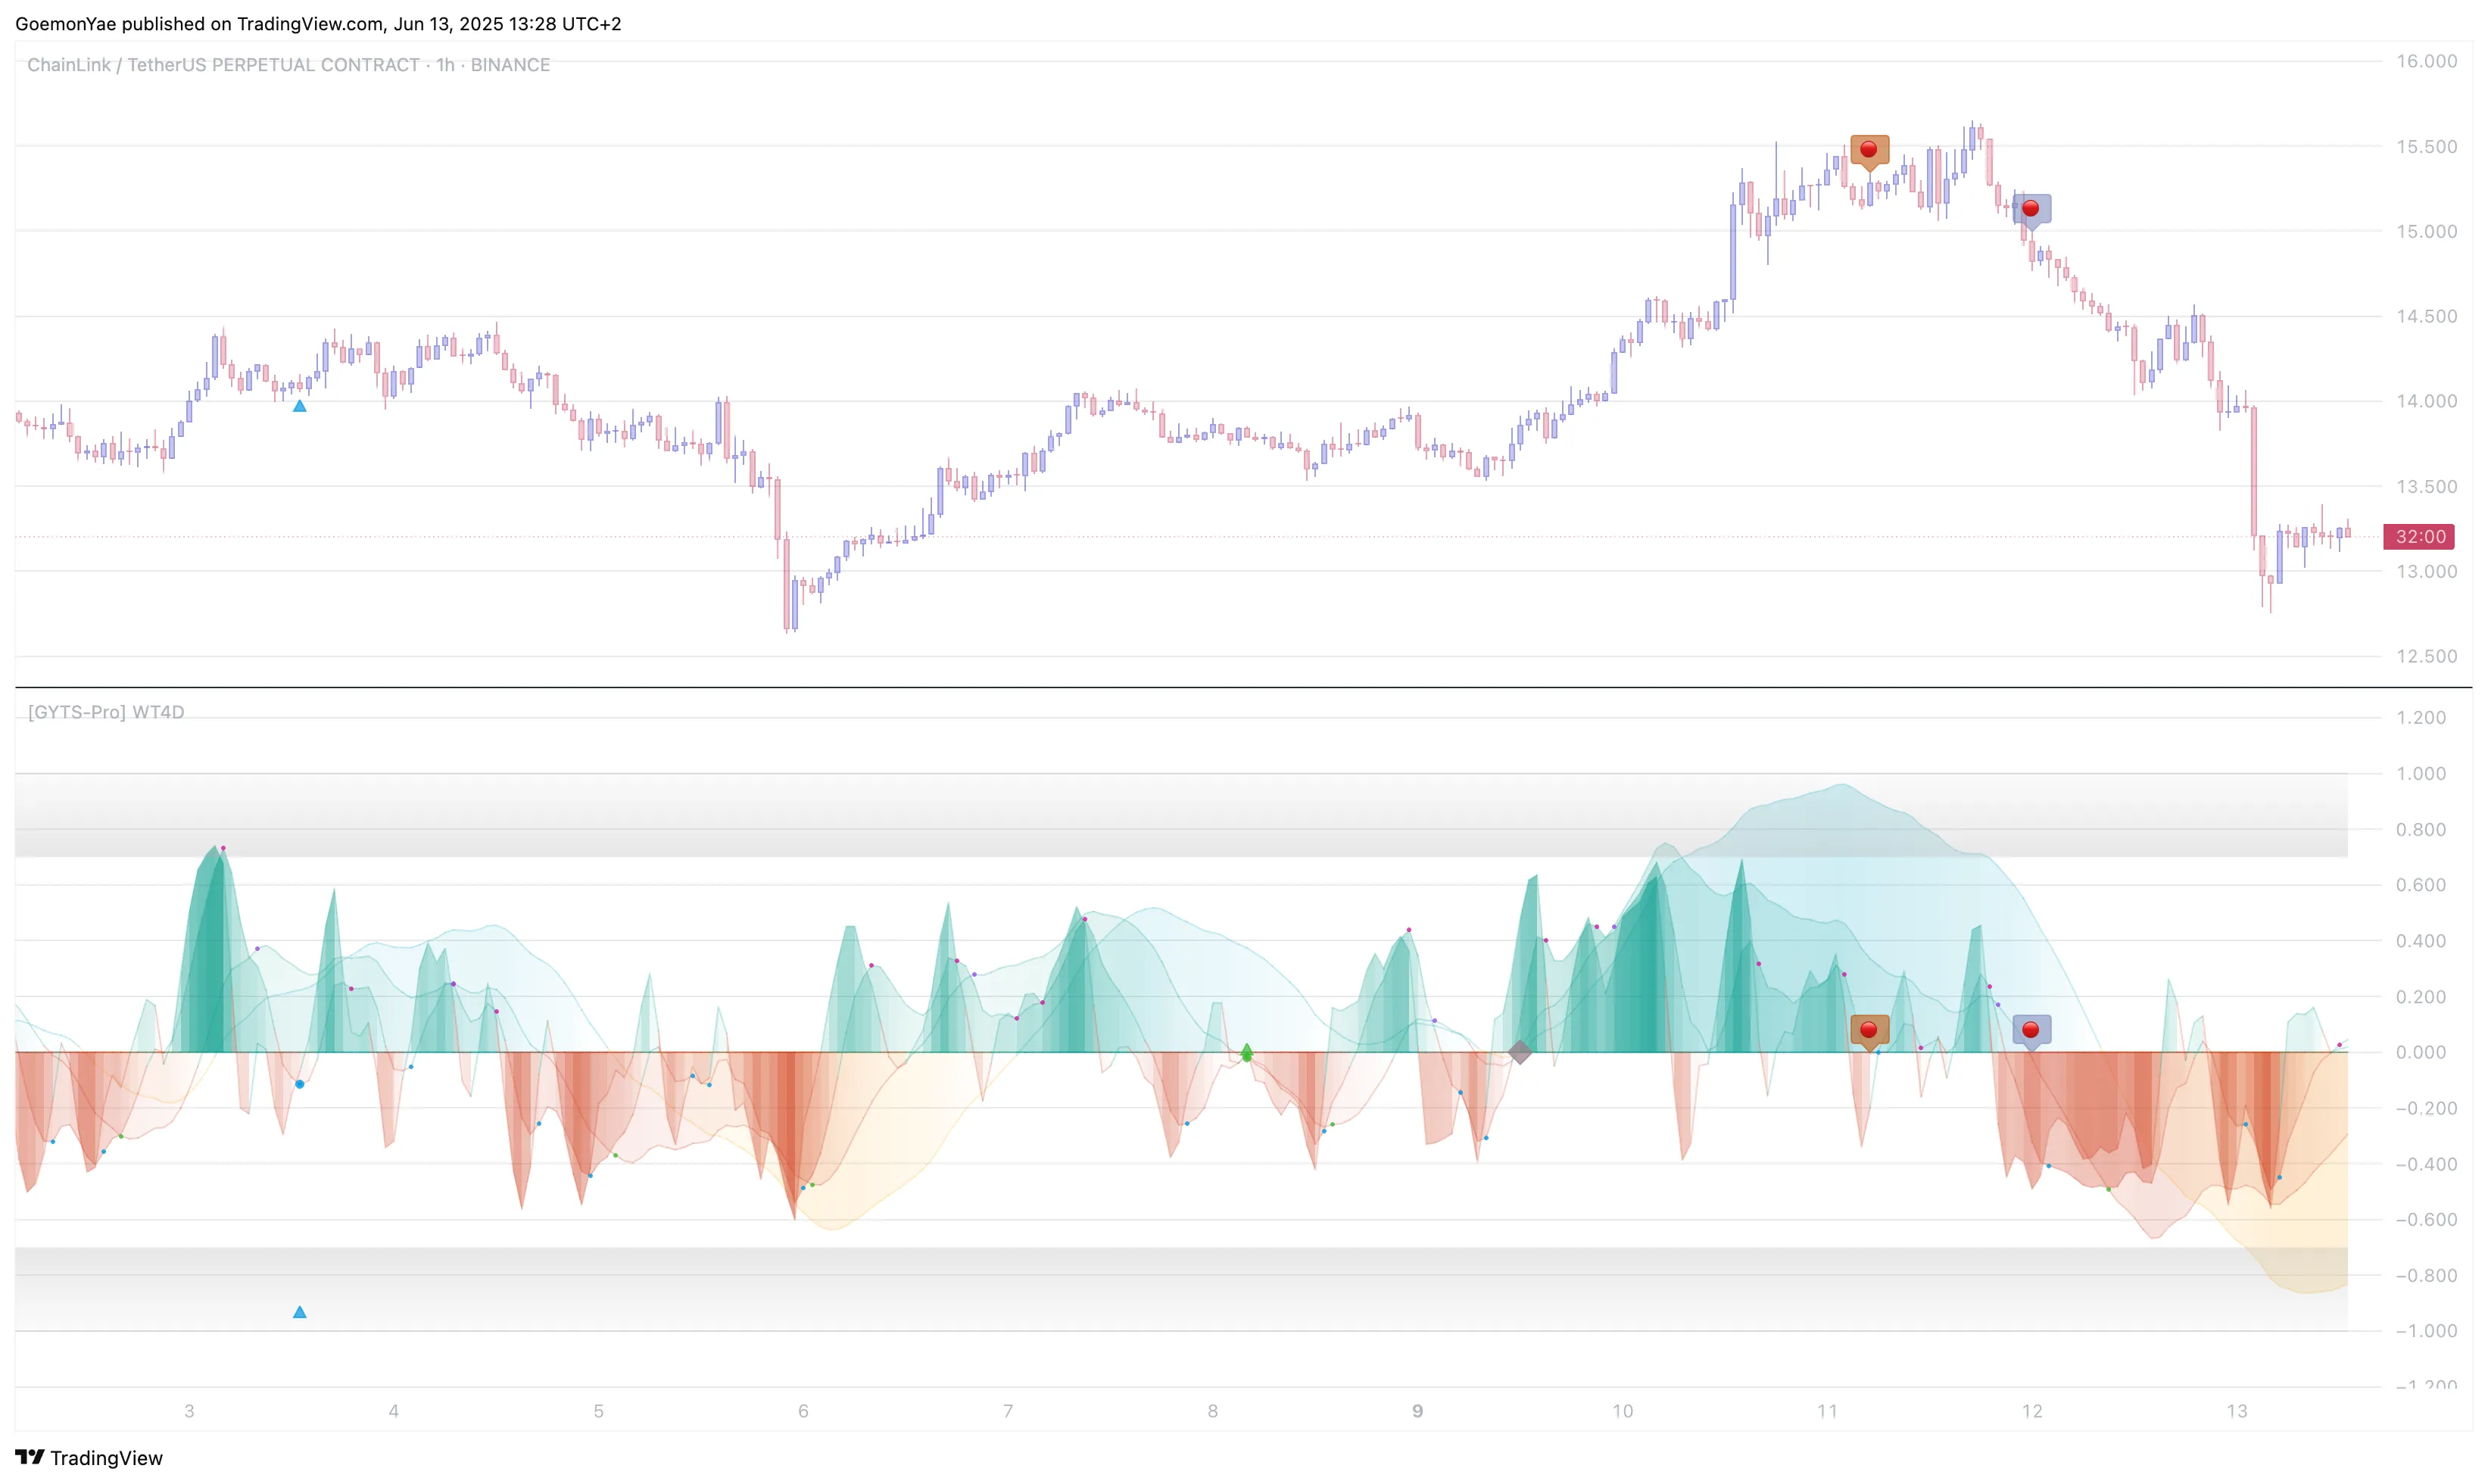
Signal Pattern: Two QMC signals align for a short opportunity
Analysis: When multiple frequency QMC signals align within proximity, this creates high-conviction reversal opportunities. The slow frequency (silver) confirmation adds substantial weight to the normal frequency (bronze) signal, indicating genuine momentum exhaustion rather than temporary noise.
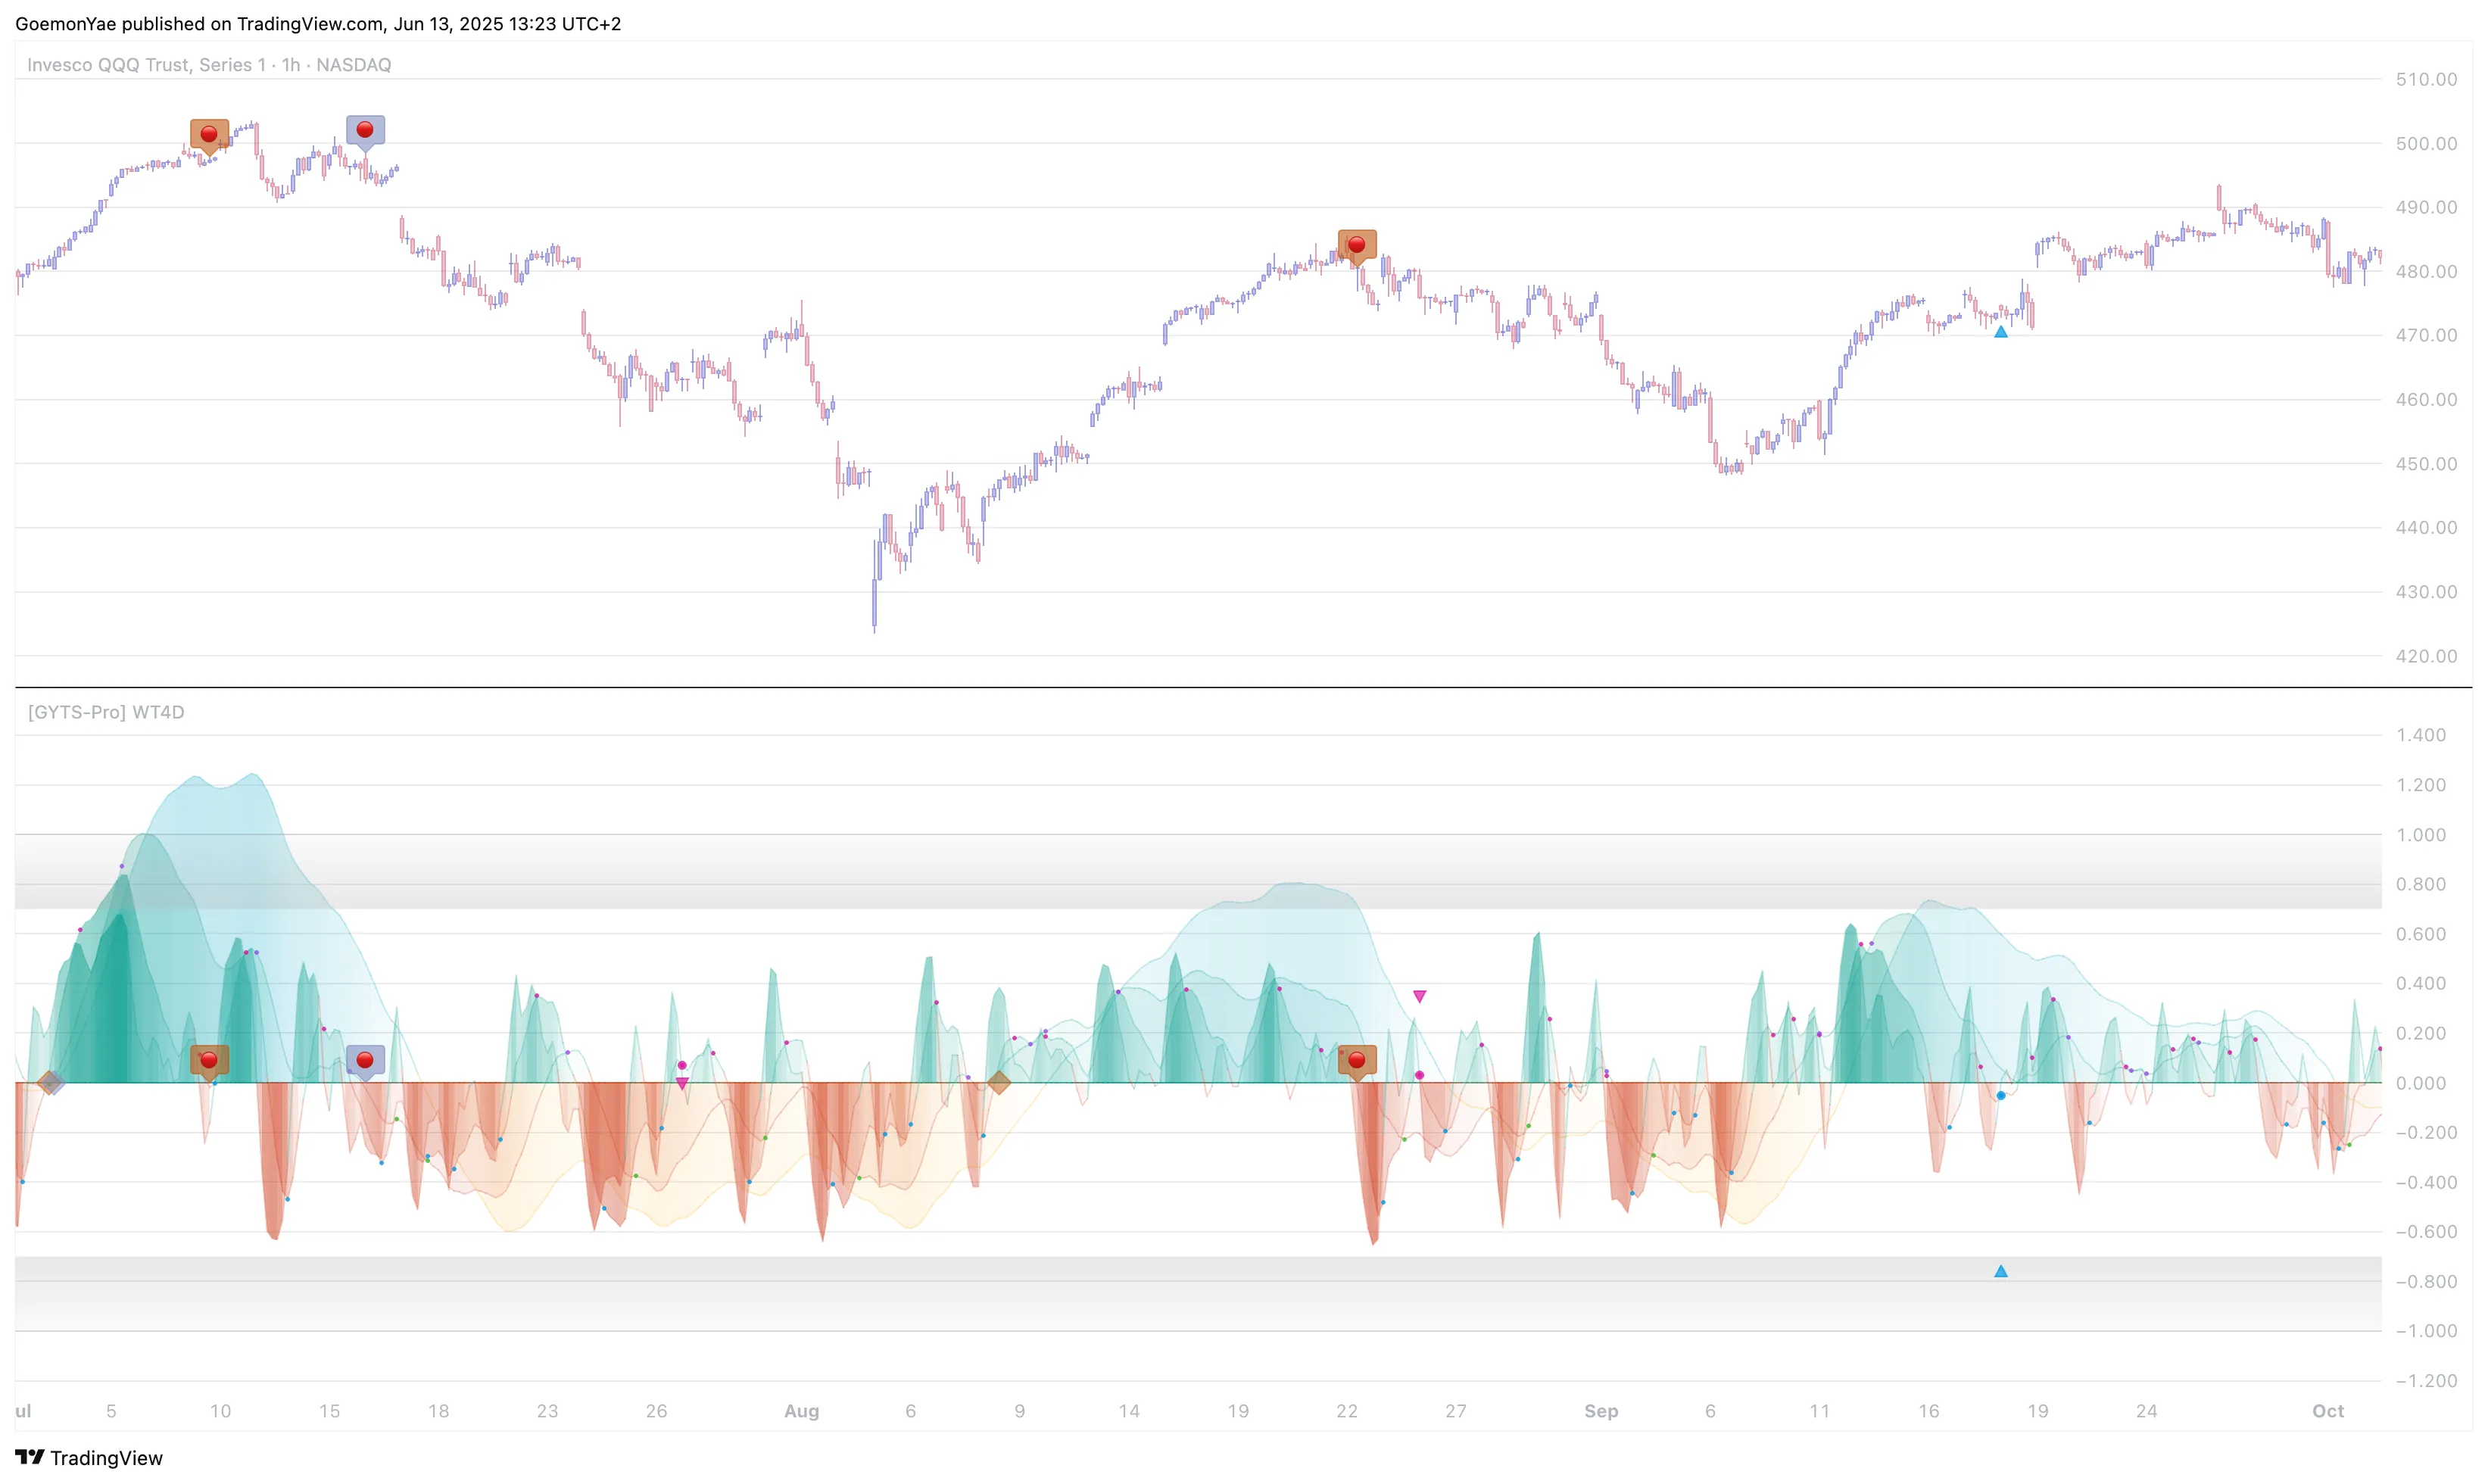
Signal Pattern: Multiple signals with varying strength levels
Analysis: This scenario demonstrates the critical importance of signal strength discrimination. Whilst multiple signals occurred, only one possessed sufficient mathematical conviction (above the strong signal threshold) to warrant serious consideration. This filtering mechanism prevents overtrading on weak signals.
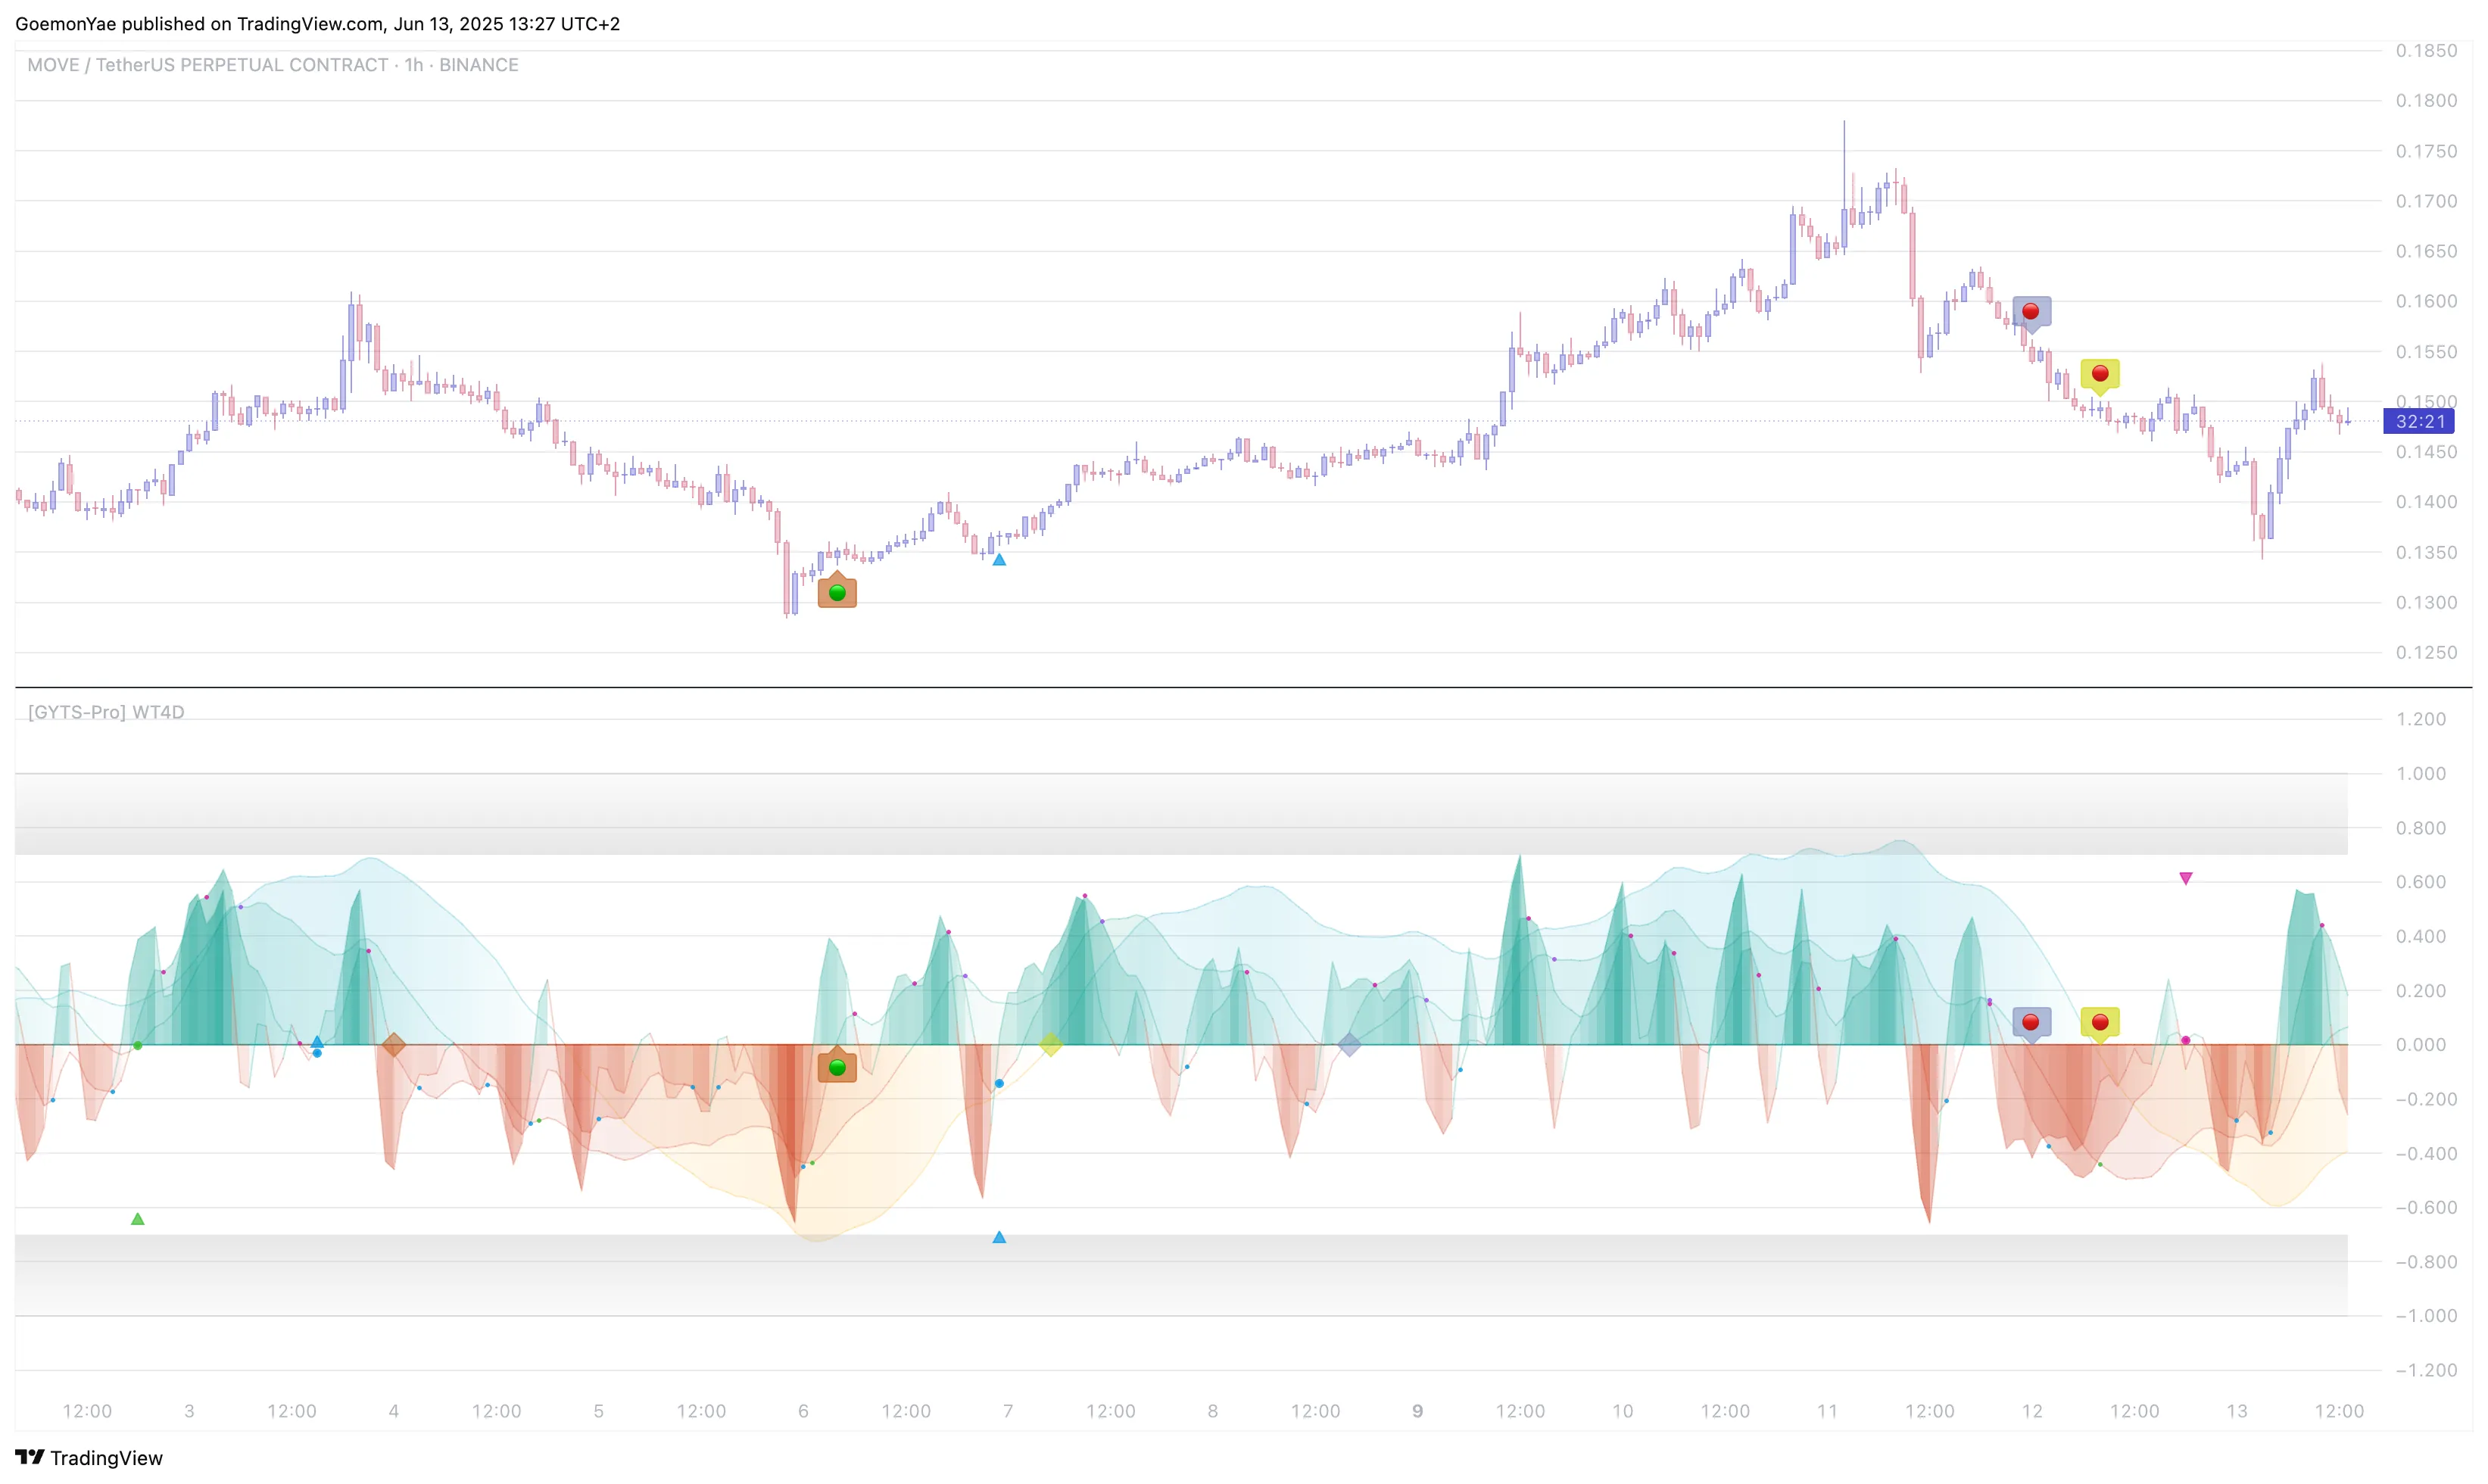
Signal Pattern: High signal frequency environment
Analysis: This scenario illustrates two crucial principles:
WaveTrend 4D’s configuration follows a logical progression through six distinct groups in TradingView’s settings panel. Like constructing a sophisticated trading instrument, each group builds upon the previous, creating a cohesive analytical framework that adapts to your specific market focus.
The foundation of any trading tool is how it presents information. WaveTrend 4D’s visualisation settings control not only what you see, but how you interact with multiple indicators and timeframes.
Key Settings Explained:
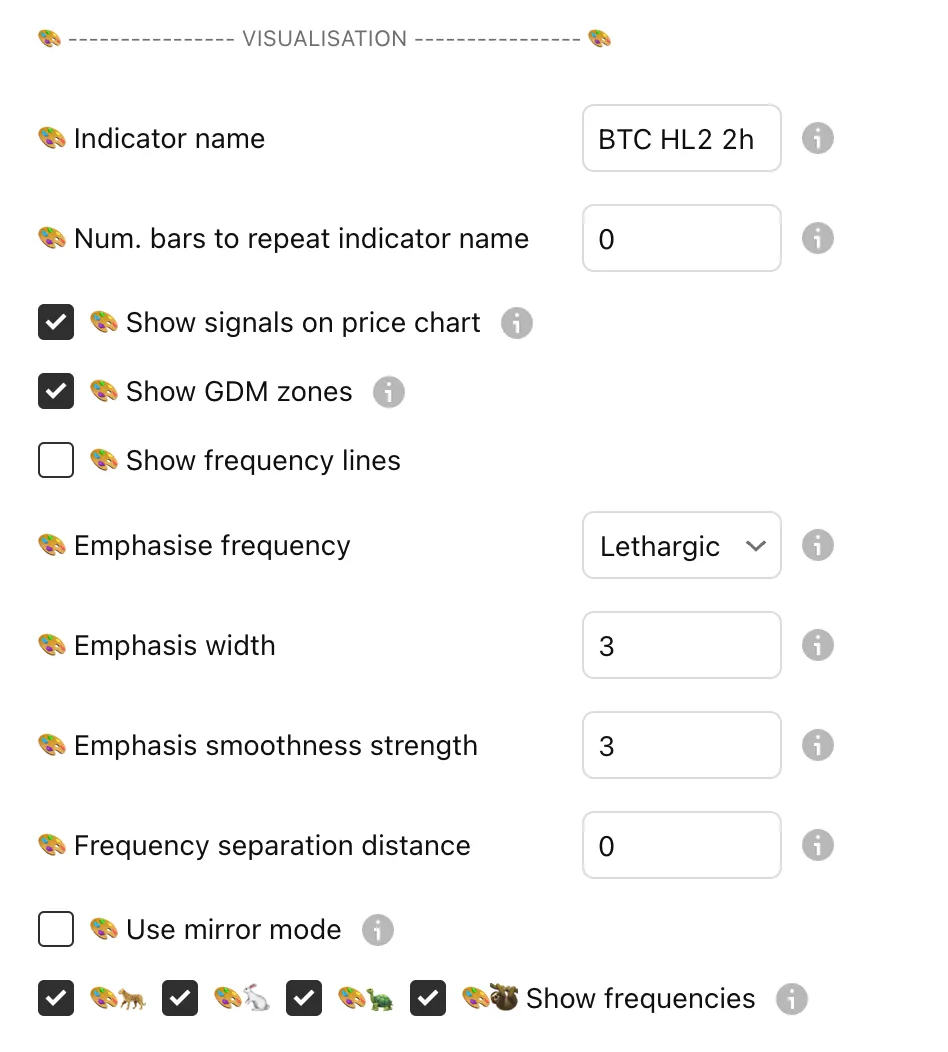
🎨 Indicator Name: Handy when using the Signal Provider multiple times on a chart. Use descriptive names like BTC HL2 2h (as in screenshot) or Main aggressive to distinguish between different configurations on the same chart.
🎨 Num. bars to repeat indicator name: Automatically displays your custom name at regular intervals when scrolling through historical data. Set to 0 to disable, or use 50-500 bars for convenient identification during analysis.
🎨 Show signals on price chart: Projects strong GDM signals (triangles) and QMC signals directly onto your price chart. This overlay creates a unified analytical view, eliminating the need to constantly reference the oscillator panel.
🎨 Show GDM zones: Displays shaded bands around the strong signal threshold (e.g. ±0.7). These zones help visually identify high-conviction areas.
🎨 Show frequency lines: Controls the visibility of all four frequency lines.
🎨 Emphasise frequency: - determines which of the four frequencies receives visual prominence with increased line width and opacity. Each of the frequencies have also a special purpose for signal generation, this will be elaborated later in the divergence settings.
🎨 Emphasis width: Line thickness for your chosen frequency (0-5). Higher values create more prominent display but may obscure other elements.
🎨 Emphasis smoothness strength: Adds a smoothed version of your emphasis frequency (0-5). This creates a trend ribbon effect, with higher values providing clearer directional bias but more lag.
🎨 Frequency separation distance: Vertically spaces frequencies for isolated analysis using multiple x-axes. Set to 0 for standard overlay mode, or use 1-3 for separated analysis when comparing different frequencies in detail.
🎨 Use mirror mode: Creates symmetrical display above and below zero. Particularly useful for pattern recognition and when using frequency separation.
🎨 Show frequencies: Individual toggles for each frequency (🐆🐇🐢🦥). Feel free to disable a few frequencies to really get a feeling of how the individual frequencies behave.
The data foundation determines everything that follows. These settings control what market information flows into WaveTrend 4D’s mathematical engine, making them crucial for confluence strategies.
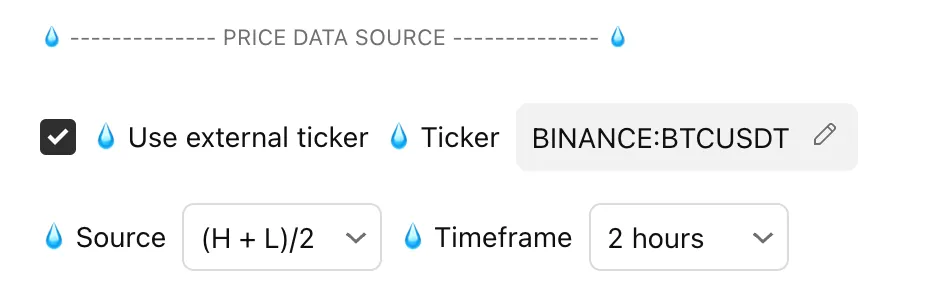
Key Settings Explained:
Especially when using multiple signal providers, this creates powerful confluence opportunities by overlaying different market perspectives.
💧 Source: Determines which price data feeds the oscillator calculation:
HL2, HLC3, OHLC4, etc., each offering different sensitivity characteristics💧 Timeframe: Critical for higher timeframe analysis. When set to a higher timeframe (e.g., 4-hours on a 1-hour chart), WaveTrend 4D automatically scales its parameters to maintain equivalent behaviour. This enables clean multi-timeframe analysis without the complexity of switching charts.
Goemon Warrior Divergence detection forms the mathematical heart of GDM signals. These settings determine when WaveTrend 4D recognises a “divergence” - the critical moments when momentum patterns suggest potential reversals.
WaveTrend 4D employs a sophisticated three-frequency analysis where faster frequencies are compared against slower frequencies for trend confirmation. The divergence occurs when waves become progressively weaker whilst the trend context (defined by slower frequencies) behaves according to your chosen criteria.
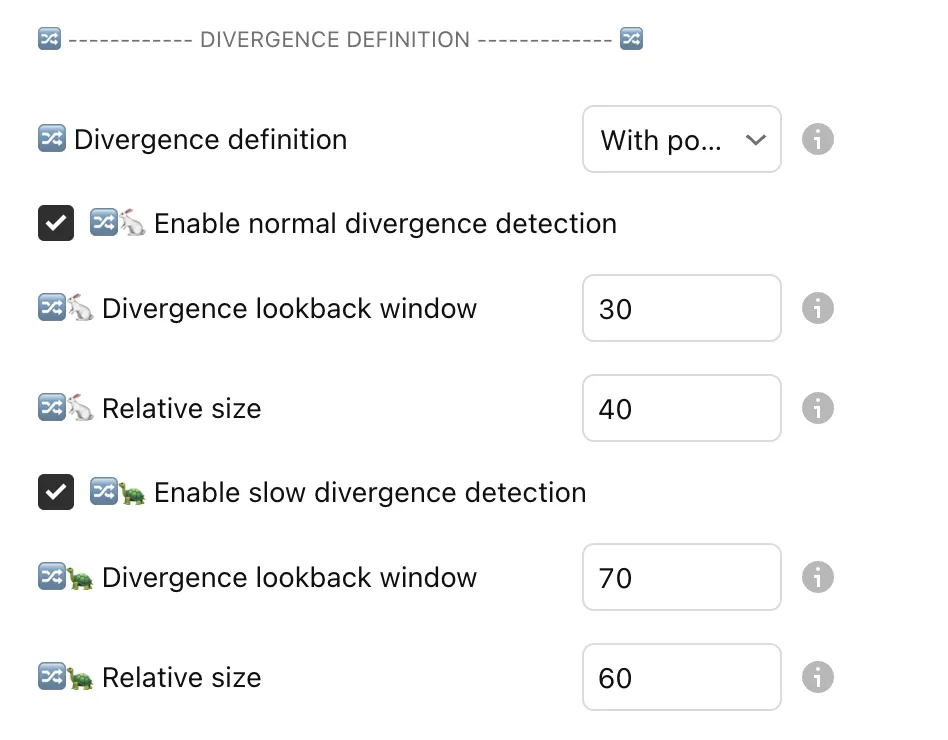
Goemon Warrior 🔀 Divergence definition: Offers four sophisticated approaches to define what constitutes a valid divergence (available in both CE and Pro editions):
🔀🐇 Enable normal divergence detection: Activates divergence analysis between Fast and Normal frequencies. Essential for tactical, shorter-term signals.
🔀🐇 Divergence lookback window: How far back to search for previous Normal frequency waves (e.g. 30 bars). Shorter windows (20-25) find divergence for volatile markets and quick moves; longer windows (40-50) also include systematic rhythms.
🔀🐇 Relative size: Current wave must be at least e.g. 40% smaller than the previous wave to qualify as divergence. Higher values (60-90%) create more signals; lower values (20-60%) demand larger differences.
🔀🐢 Enable slow divergence detection: Activates divergence analysis between Normal and Slow frequencies. These generate fewer but more significant signals for strategic positioning.
🔀🐢 Divergence lookback window: Extended window (e.g. 70 bars) for Slow frequency analysis, reflecting its longer-term nature.
🔀🐢 Relative size: Less strict requirement (e.g. 60%) for Slow frequency divergences as these signals are occurring less often.
The crown jewel of WaveTrend 4D - transforming subjective divergence recognition into quantitative science. GDM synthesises six mathematical factors to produce a single strength measure, revolutionising how we evaluate potential reversals.
The Six-Factor Formula: GDM evaluates divergence strength through 6 components, each representing a different aspect of market behaviour:
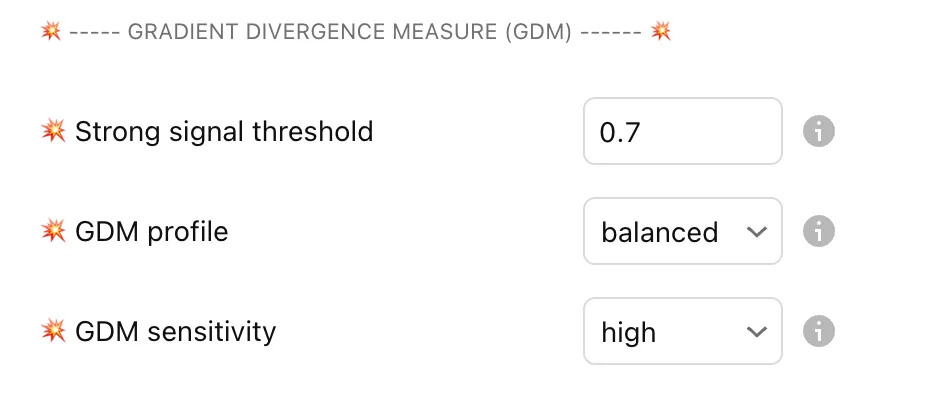
Key Settings Explained:
💥 Strong signal threshold (0.7): defines what constitutes a “significant” GDM. Values above this threshold:
Goemon Warrior 💥 GDM profile Critical setting: offers six distinct profiles:
💥 GDM sensitivity: Controls the strength of signal standardisation. Higher sensitivity creates more frequent “strong” signals:
The final sophistication layer - QMC identifies trend exhaustion by measuring the statistical significance of momentum accumulation. Rather than signalling every median cross, QMC waits for mathematically significant trend statements.
The Statistical Innovation: QMC calculates the integral between each frequency line and zero, then ranks these areas historically. Only when a substantial trend (top percentile) finally crosses the median does QMC generate a signal.
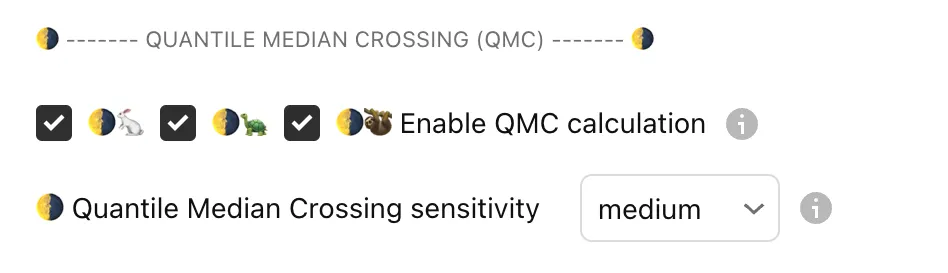
Key Settings Explained:
🌗🐇 Normal QMC: Enables bronze label signals for tactical reversal opportunities. These represent the exhaustion of short-term momentum bursts.
🌗🐢 Slow QMC: Activates silver label signals for significant reversal potential. These indicate the weakening of intermediate trends.
🌗🦥 Lethargic QMC: Generates gold label signals for major trend exhaustion. These are the rarest and most significant signals, often marking important cycle turns.
Goemon Warrior 🌗 QMC sensitivity provides five levels:
🌗 Min. sample size: Requires a minimum of 20 (default) historical trend periods to ensure statistical validity for QMC signals.
Signal Hierarchy: QMC signals follow a natural hierarchy of significance:
When multiple QMC signals align (e.g., silver and bronze together), this creates exceptionally high-conviction reversal opportunities.
The mathematical foundation that transforms raw price data into the elegant wave patterns you see. These parameters control the core signal processing engine, determining sensitivity, smoothness, and the character of each frequency.
The Digital Signal Processing Foundation:
WaveTrend 4D employs John Ehlers’ sophisticated approach to momentum analysis, using dual-pole filtering and hyperbolic tangent normalisation . Unlike traditional moving average-based oscillators, this approach provides superior smoothness with reduced lag.
Key Settings Explained:
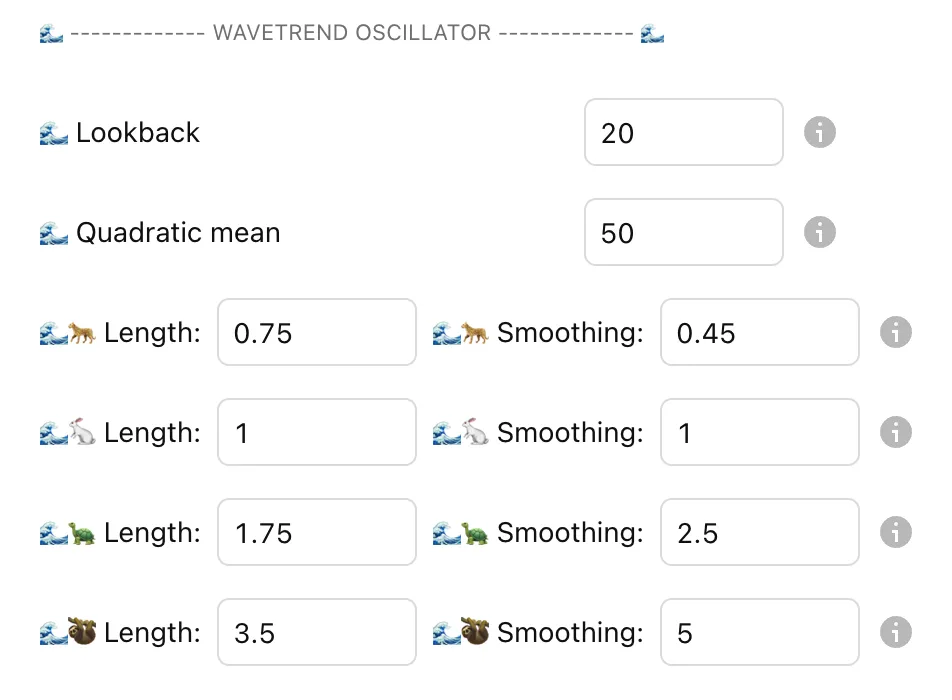
🌊 Lookback: Defines the base lookback period (default: 20 bars) for the oscillator’s smoothing filters. All frequency-specific smoothing parameters scale from this value, making it the primary sensitivity control for the oscillator’s responsiveness:
🌊 Quadratic mean: The normalisation window (default: 50) that adapts the oscillator to varying market volatility. Longer periods create more stable normalisation but slower adaptation to regime changes.
🌊🐆 Fast Length & Smoothing: Creates the most responsive frequency, capturing rapid momentum shifts. These factors scale the base lookback period, making Fast approximately half the timeframe of Normal.
🌊🐇 Normal Length & Smoothing: The baseline frequency representing your chart’s timeframe. All other frequencies scale relative to these values.
🌊🐢 Slow Length & Smoothing: Filters out short-term noise to reveal intermediate trends. The higher smoothing factor creates the characteristic lag that makes this frequency ideal for trend confirmation.
🌊🦥 Lethargic Length & Smoothing: Provides deep, structural market analysis. This frequency often reveals major cycle turns and acts as the ultimate trend filter.
Scaling Philosophy: Each frequency represents a different temporal perspective of the same market. Think of them as different camera lenses - wide-angle (Lethargic) for the big picture, standard (Normal) for balanced view, and macro (Fast) for immediate detail.
WaveTrend 4D’s six configuration groups follow a logical progression from basic visualisation to advanced signal generation. Each group builds or expands upon the previous, creating a comprehensive analytical framework:
Master each group progressively - start with basic visualisation settings, establish reliable data sources, then gradually explore the advanced signal generation capabilities that make WaveTrend 4D a sophisticated analytical instrument.
WaveTrend 4D generates two distinct signal types that flow to the Flux Composer:
Both streams undergo aggregation through the Flux Composer’s confluence mechanisms and temporal decay functions, creating a unified trading signal.
Primary Signal Mode, used for sophisticated aggregation in Flux Composer
Alternative Binary Mode
While WaveTrend 4D supports traditional TradingView alerts, we recommend using the Order Orchestrator for professional trading execution. Order Orchestrator provides superior position management, risk controls, and automated execution that far exceed basic alert capabilities.
Basic Alert Types (if needed):
Configure WaveTrend 4D
Connect with Flux Composer
Locate Data Streams
High-Volatility Markets
short-term waves or regular divergencemedium to highhighNormal20-25, Slow: 50-60)For volatile assets, prioritise responsiveness but filter for stronger signals to avoid noise.
Trending Markets
balanced or long-term wavesmediummedium to highSlow30, Slow: 70)Forex pairs often exhibit clearer trends, benefiting from balanced, trend-focused settings.
Lower-Volatility Markets
long-term waves or overbought/oversoldlow to mediumlowSlow or Lethargic40, Slow: 90)Indices favour longer-term analysis to capture significant trend shifts and avoid noise from minor fluctuations.
Although the Flux Composer aggregates and quantifies signals automatically, understanding their individual meanings is crucial for effective trading decisions.
GDM Signals:
QMC Signals:
Understanding these frequent errors can dramatically improve your WaveTrend 4D implementation:
❌ Changing too many settings at once → Start with defaults, adjust one parameter at a time
❌ Trading every signal that appears → Focus only on signals above the shaded GDM zones (±0.7)
❌ Ignoring frequency alignment → Best signals occur when multiple frequencies agree (e.g., both Fast and Normal near extremes)
❌ Using on timeframes below 15 minutes → WaveTrend 4D performs optimally on 15m+ timeframes where noise is filtered
| Feature | CE | Pro |
|---|---|---|
| Core Architecture | ||
| Four Frequency Analysis | ||
| Signal Provider | ||
| Signal Stream Output | ||
| External Ticker Support | ||
| Higher Timeframe Support | ||
| Sophisticated Output Streams | ||
| GYTS Suite Compatibility | ||
| GDM (Gradient Divergence Measure) | ||
| GDM Calculation | In separate indicator | Integrated |
| GDM Profiles | 1 (Balanced only) | 6 profiles |
| GDM Sensitivity Levels | 5 levels | 5 levels |
| Divergence Definitions | 4 modes | 4 modes |
| Strong Signal Threshold | ||
| QMC (Quantile Median Cross) | ||
| QMC Calculation | In separate indicator | Integrated |
| QMC Sensitivity | Fixed (Medium) | 5 levels |
| Frequency Selection | 3 frequencies | 3 frequencies |