

Bullish Trending
Sustained upward price movement where trend-following strategies excel.
Momentum begets momentum as buyers dominate the narrative.
Like a sage reading the wind patterns across mountain peaks, the Market Regime Detector perceives the subtle rhythms that govern market behaviour. This oracle of market consciousness identifies whether prices flow in trending rivers or oscillate in cyclic tides, enabling traders to harmonise their strategies with the market’s deeper nature.
Building upon the mathematical foundations of digital signal processing methods, it employs consensus-based detection to ensure your trading approach aligns with the market’s true character—embodying our core value of multilayered resilience through diverse analytical perspectives.
As the Market Context Provider, the Market Regime Detector serves as the strategic foundation of the GYTS TradingView Suite. It continuously analyses market behaviour to identify the current regime (trending or cyclic), which then informs the Order Orchestrator to adapt strategy selection accordingly.
Hover over components to see details. Lines indicate data flow between components.
Market regime detection is the process of identifying the current behavioural state of a financial market. Markets don’t behave uniformly — they cycle between periods of strong directional movement (trending) and periods of oscillation around a mean (ranging or cyclic). Recognising which regime currently dominates is crucial for selecting appropriate trading strategies and managing risk effectively.
The Market Regime Detector processes market data through five distinct stages:
Each stage contributes to a robust detection system that minimises false transitions whilst maintaining responsiveness to genuine market shifts. The consensus approach ensures no single method can trigger spurious regime changes, creating stability without sacrificing adaptability.
Markets perpetually shift between distinct behavioural regimes, each demanding fundamentally different trading approaches:
Bullish Trending
Sustained upward price movement where trend-following strategies excel.
Momentum begets momentum as buyers dominate the narrative.
Bearish Trending
Persistent downward pressure requiring defensive positioning.
Short strategies and capital preservation take precedence.
Cyclic (Range-Bound)
Oscillating price action between boundaries.
Mean-reversion strategies thrive whilst trend-following approaches struggle.
The Market Regime Detector transforms subjective market analysis into quantitative science through automatic dominant cycle detection and multi-method consensus . Unlike traditional indicators that rely on fixed parameters, it adapts dynamically to evolving market rhythms.
At the heart of the Professional Edition lies our proprietary dominant cycle detection algorithm. Rather than requiring manual input of cycle periods, the system automatically identifies and adapts to the market’s natural rhythm in real-time, ensuring your analysis always aligns with current market conditions.
The Professional Edition employs five complementary detection methods, each analysing different market dimensions:
The following diagrams illustrate how the Market Regime Detector processes market data to determine the current regime. Choose between the high-level overview for quick understanding or the comprehensive diagram for detailed technical context.
Input Processing:
Method-Specific Analysis:
Strength Calculation:
Consensus Mechanisms:
Visual Output:
The Market Regime Detector’s configuration is elegantly simple yet powerful, distilling complex market analysis into three intuitive parameter groups. Unlike indicators with dozens of settings, this focused approach ensures you can quickly optimise for your specific market and trading style.
The heart of the detector—three elegantly simple parameters that control all five detection methods simultaneously.
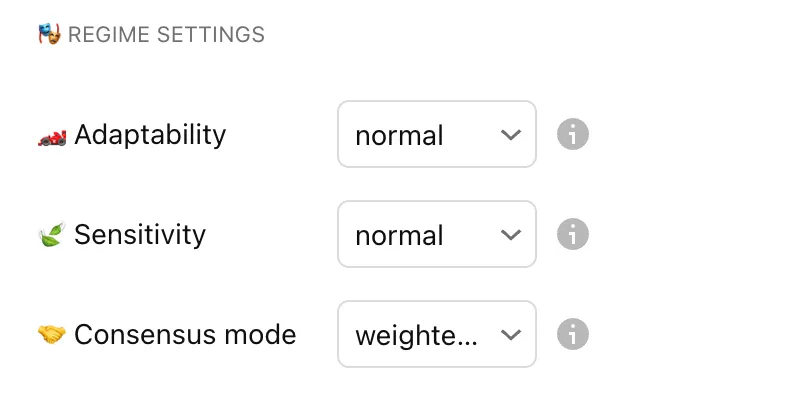
Controls how quickly the detector responds to changing market conditions. This parameter affects the lookback periods and filter parameters across all five detection methods:
| Setting | Behaviour | Best For |
|---|---|---|
| Very Low | Maximum stability, rare regime changes | Major trend identification |
| Low | Conservative adaptation | Position trading |
| Normal | Balanced responsiveness (default) | General purpose |
| High | Quick adaptation to new conditions | Swing trading |
| Very High | Rapid response, frequent updates | Scalping/testing |
Determines the conviction threshold for regime transitions. This parameter controls the detection thresholds across all methods:
| Setting | Threshold Behaviour | Signal Frequency |
|---|---|---|
| Very Low | Requires overwhelming evidence | Rare, high-conviction signals |
| Low | Conservative detection | Fewer false positives |
| Normal | Balanced approach (default) | Moderate frequency |
| High | Detects subtle changes | More responsive |
| Very High | Hair-trigger detection | Maximum signals |
To truly grasp the power of these settings, let’s observe their impact on a GBP/USD 4-hour chart. The 🏎️ Adaptability and 🍃 Sensitivity settings are your primary controls for adjusting how the detector perceives market changes.
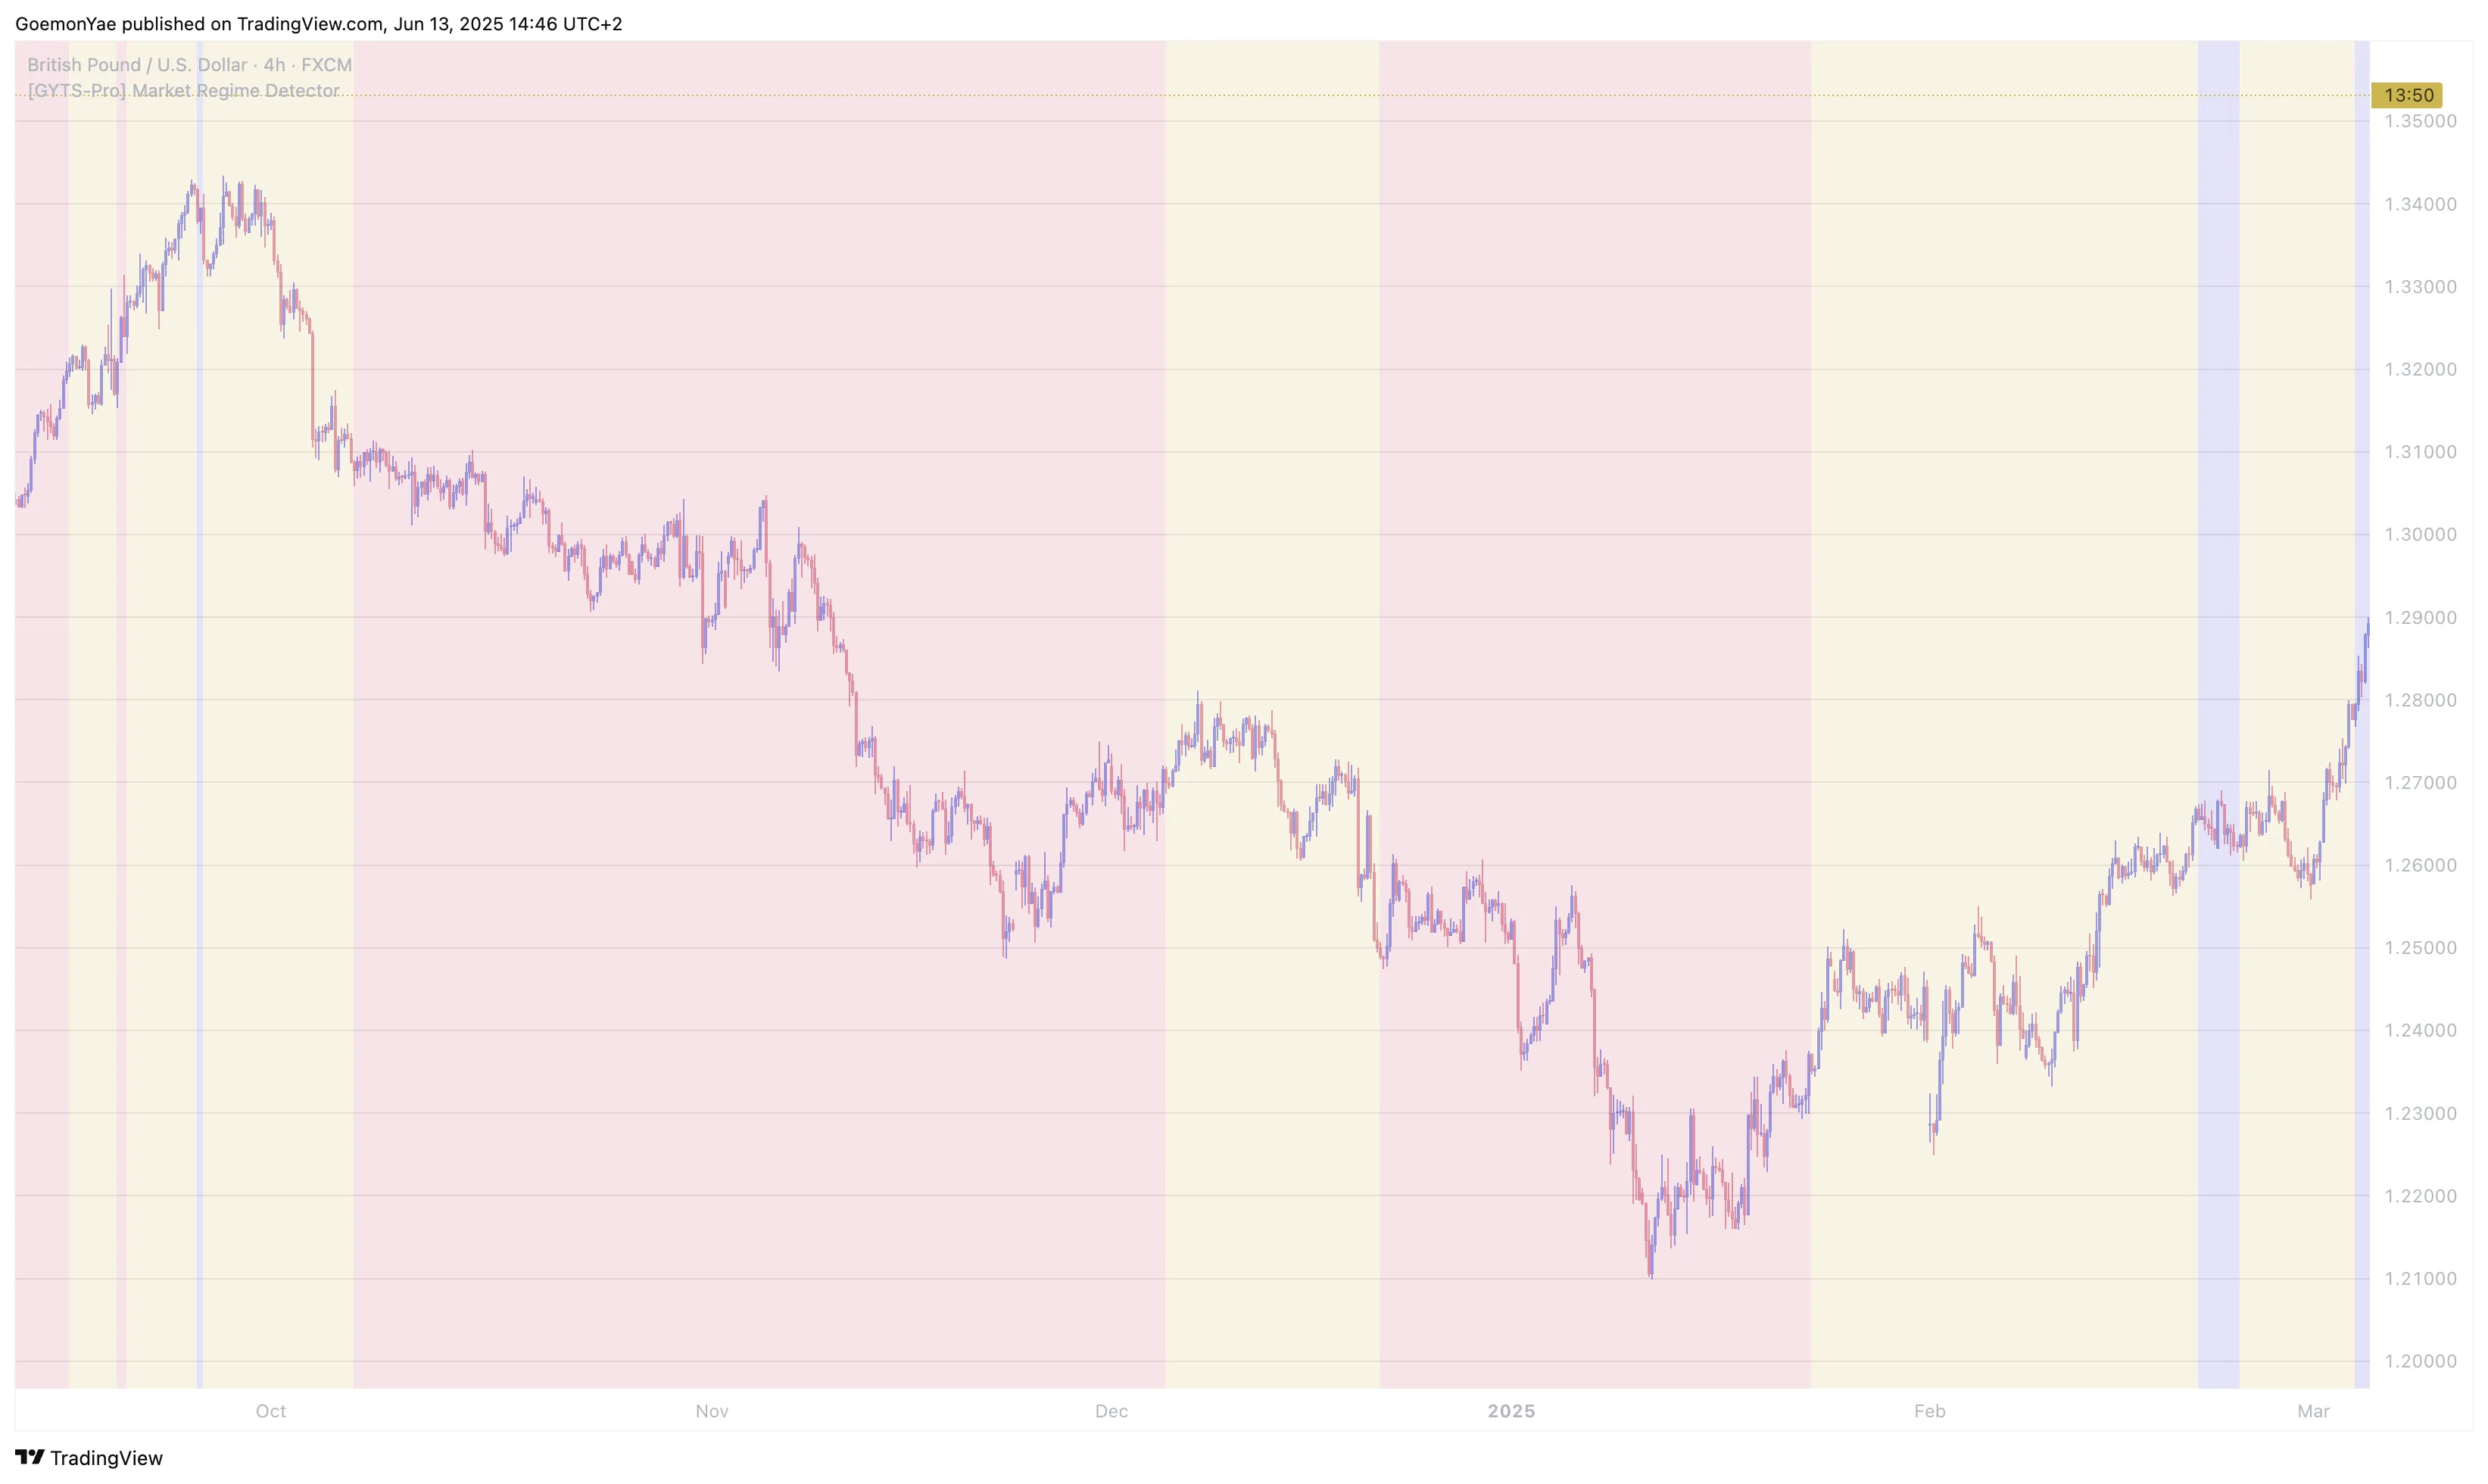
Analysis:
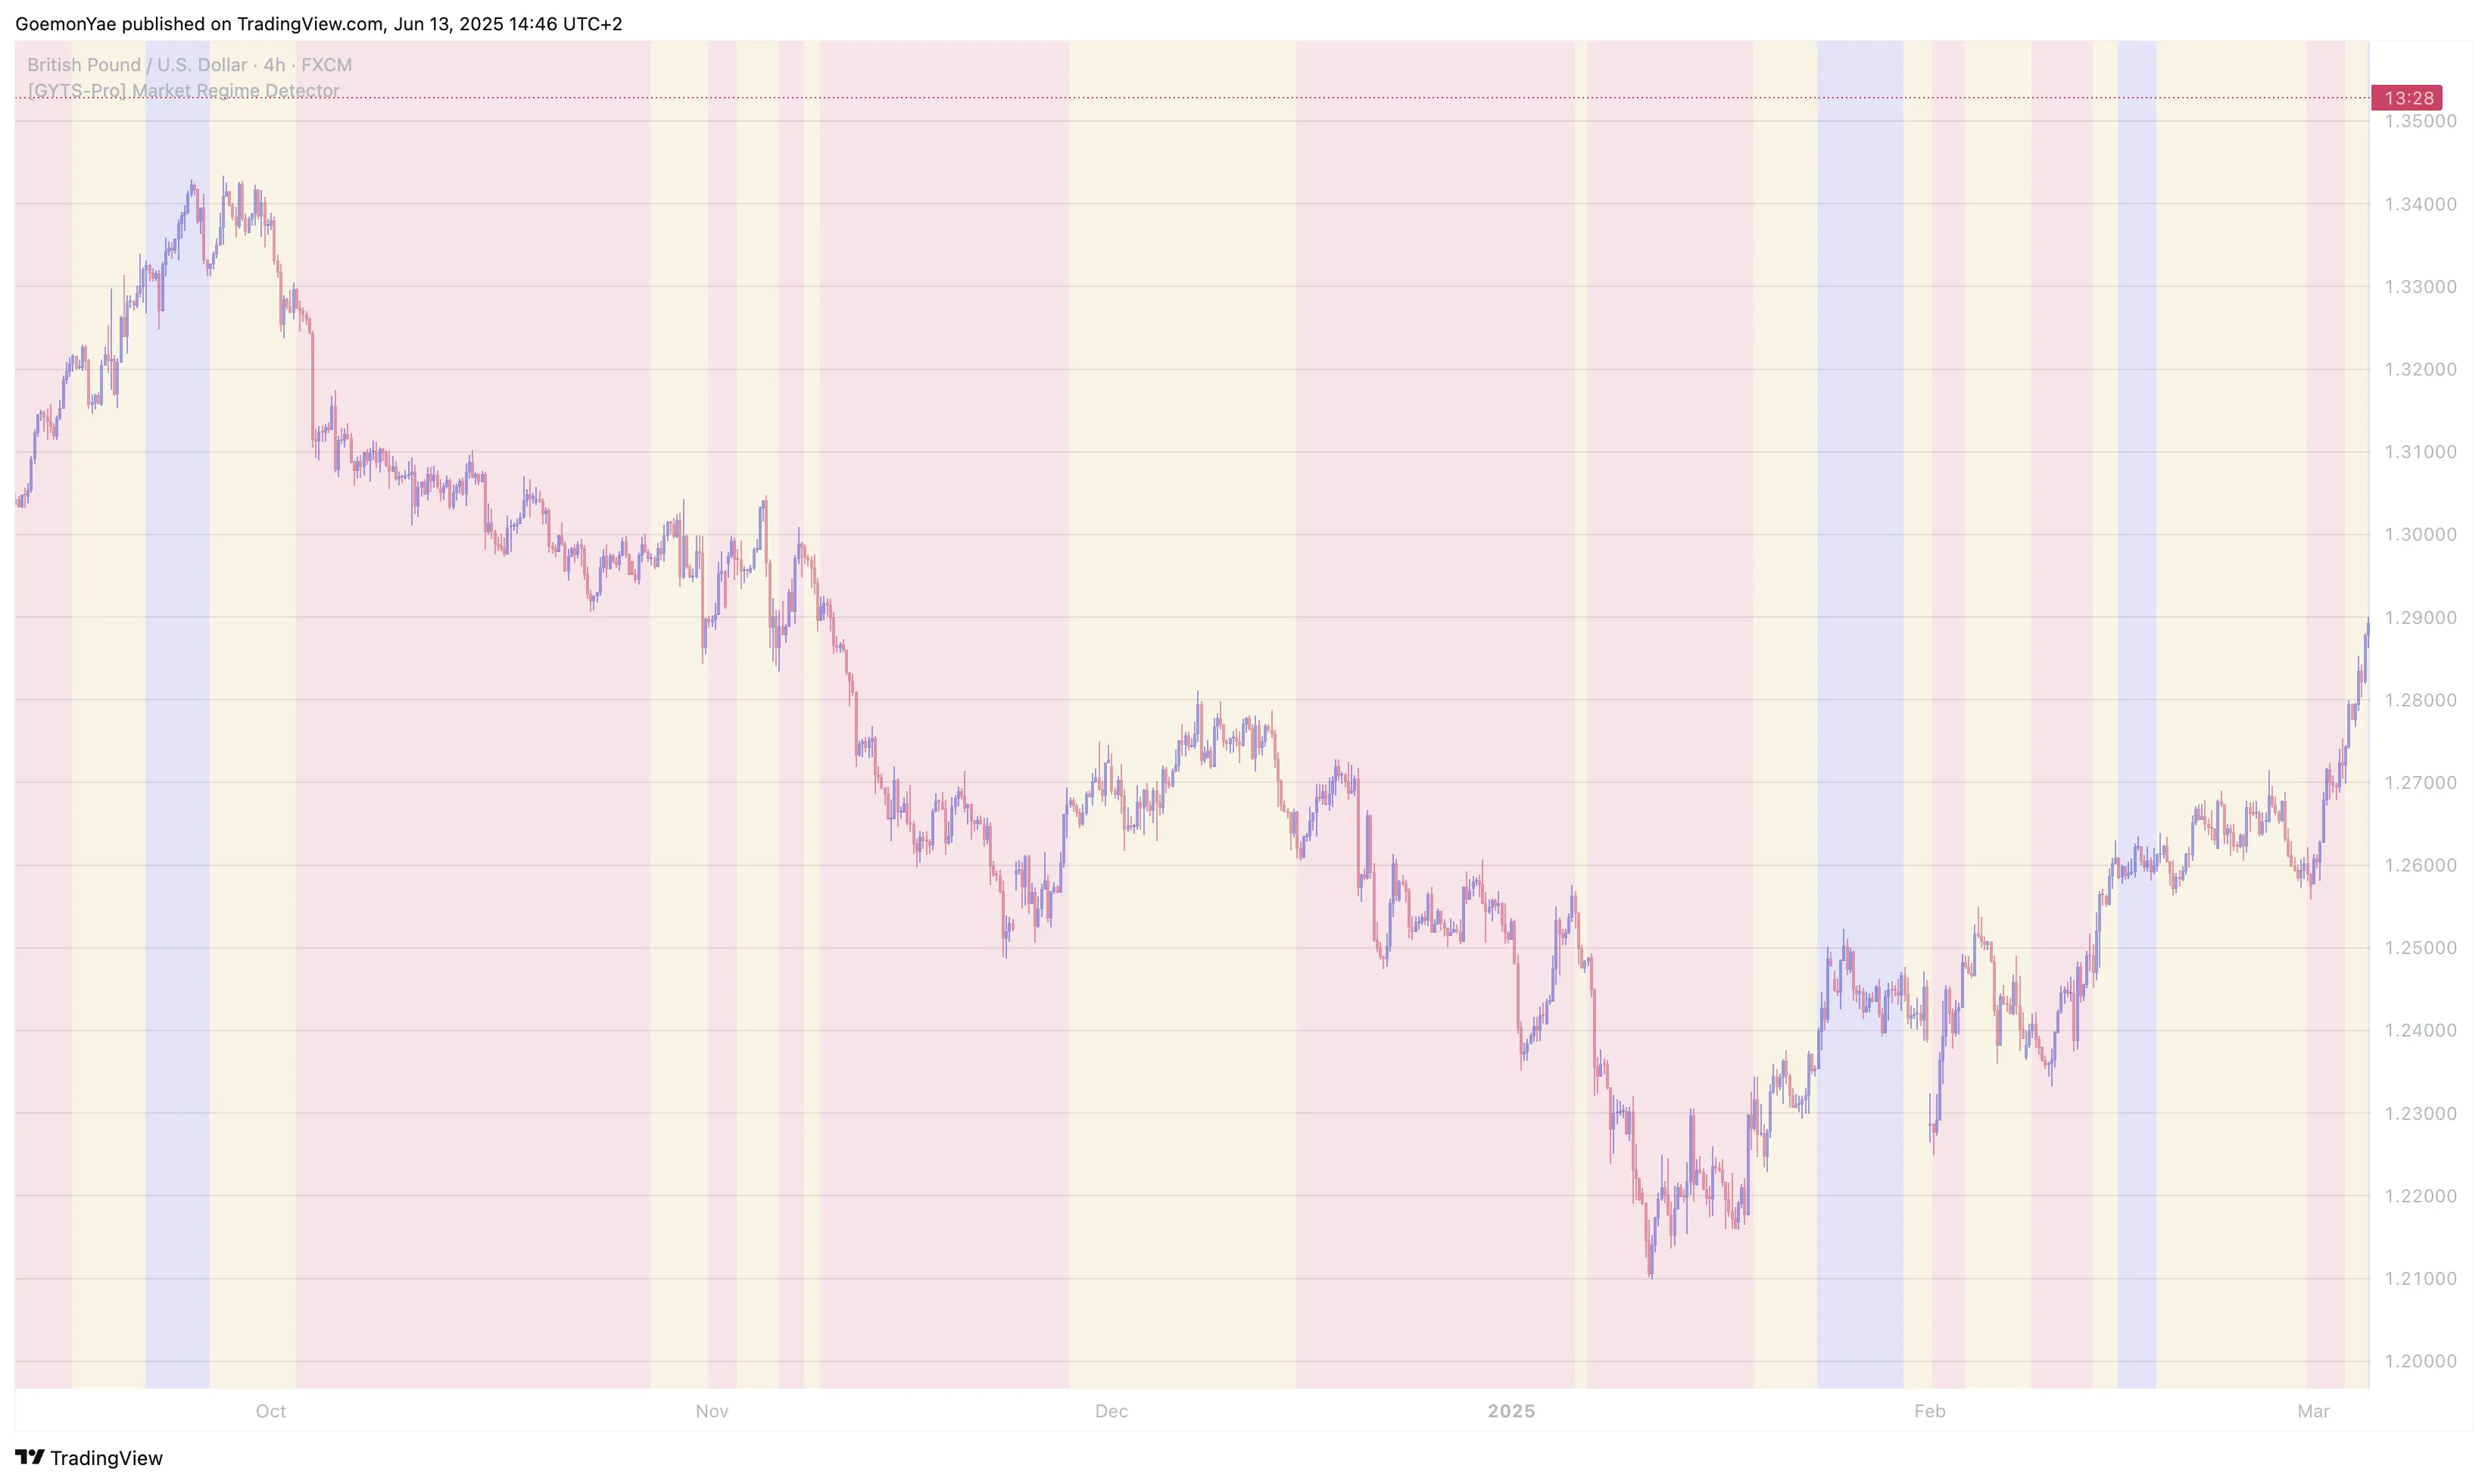
Analysis:
Defines how the five detection methods combine their signals. Each mode has distinct characteristics:
| Mode | Logic | Best For |
|---|---|---|
| Any Method (OR) | Most sensitive — triggers when any method detects a regime | Quick response trading |
| All Methods (AND) | Most conservative — requires unanimous agreement | High-conviction trades |
| Weighted Decision | Democratic voting with equal weighting | Balanced approach (default) |
| Strength-Weighted Goemon Warrior | Stronger signals get more influence | Adaptive precision |
The foundation of your market regime analysis begins with selecting the appropriate data source and display preferences.
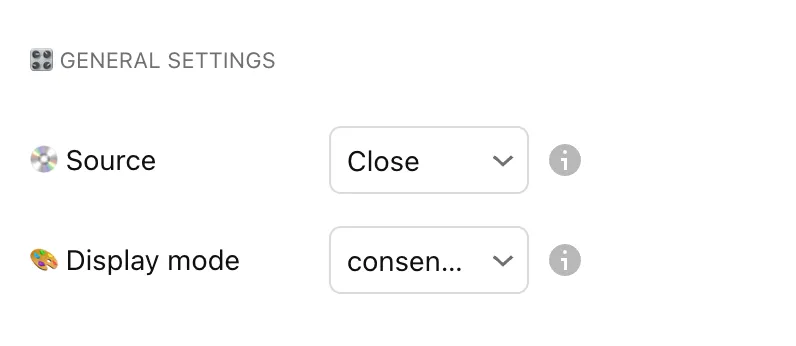
Key Settings Explained:
💧 Source: Determines which price data feeds into the detector
🎨 Display Mode: Controls how regime information is visualised. This choice depends on whether you need clear, binary signals or a more nuanced, continuous view of market strength.
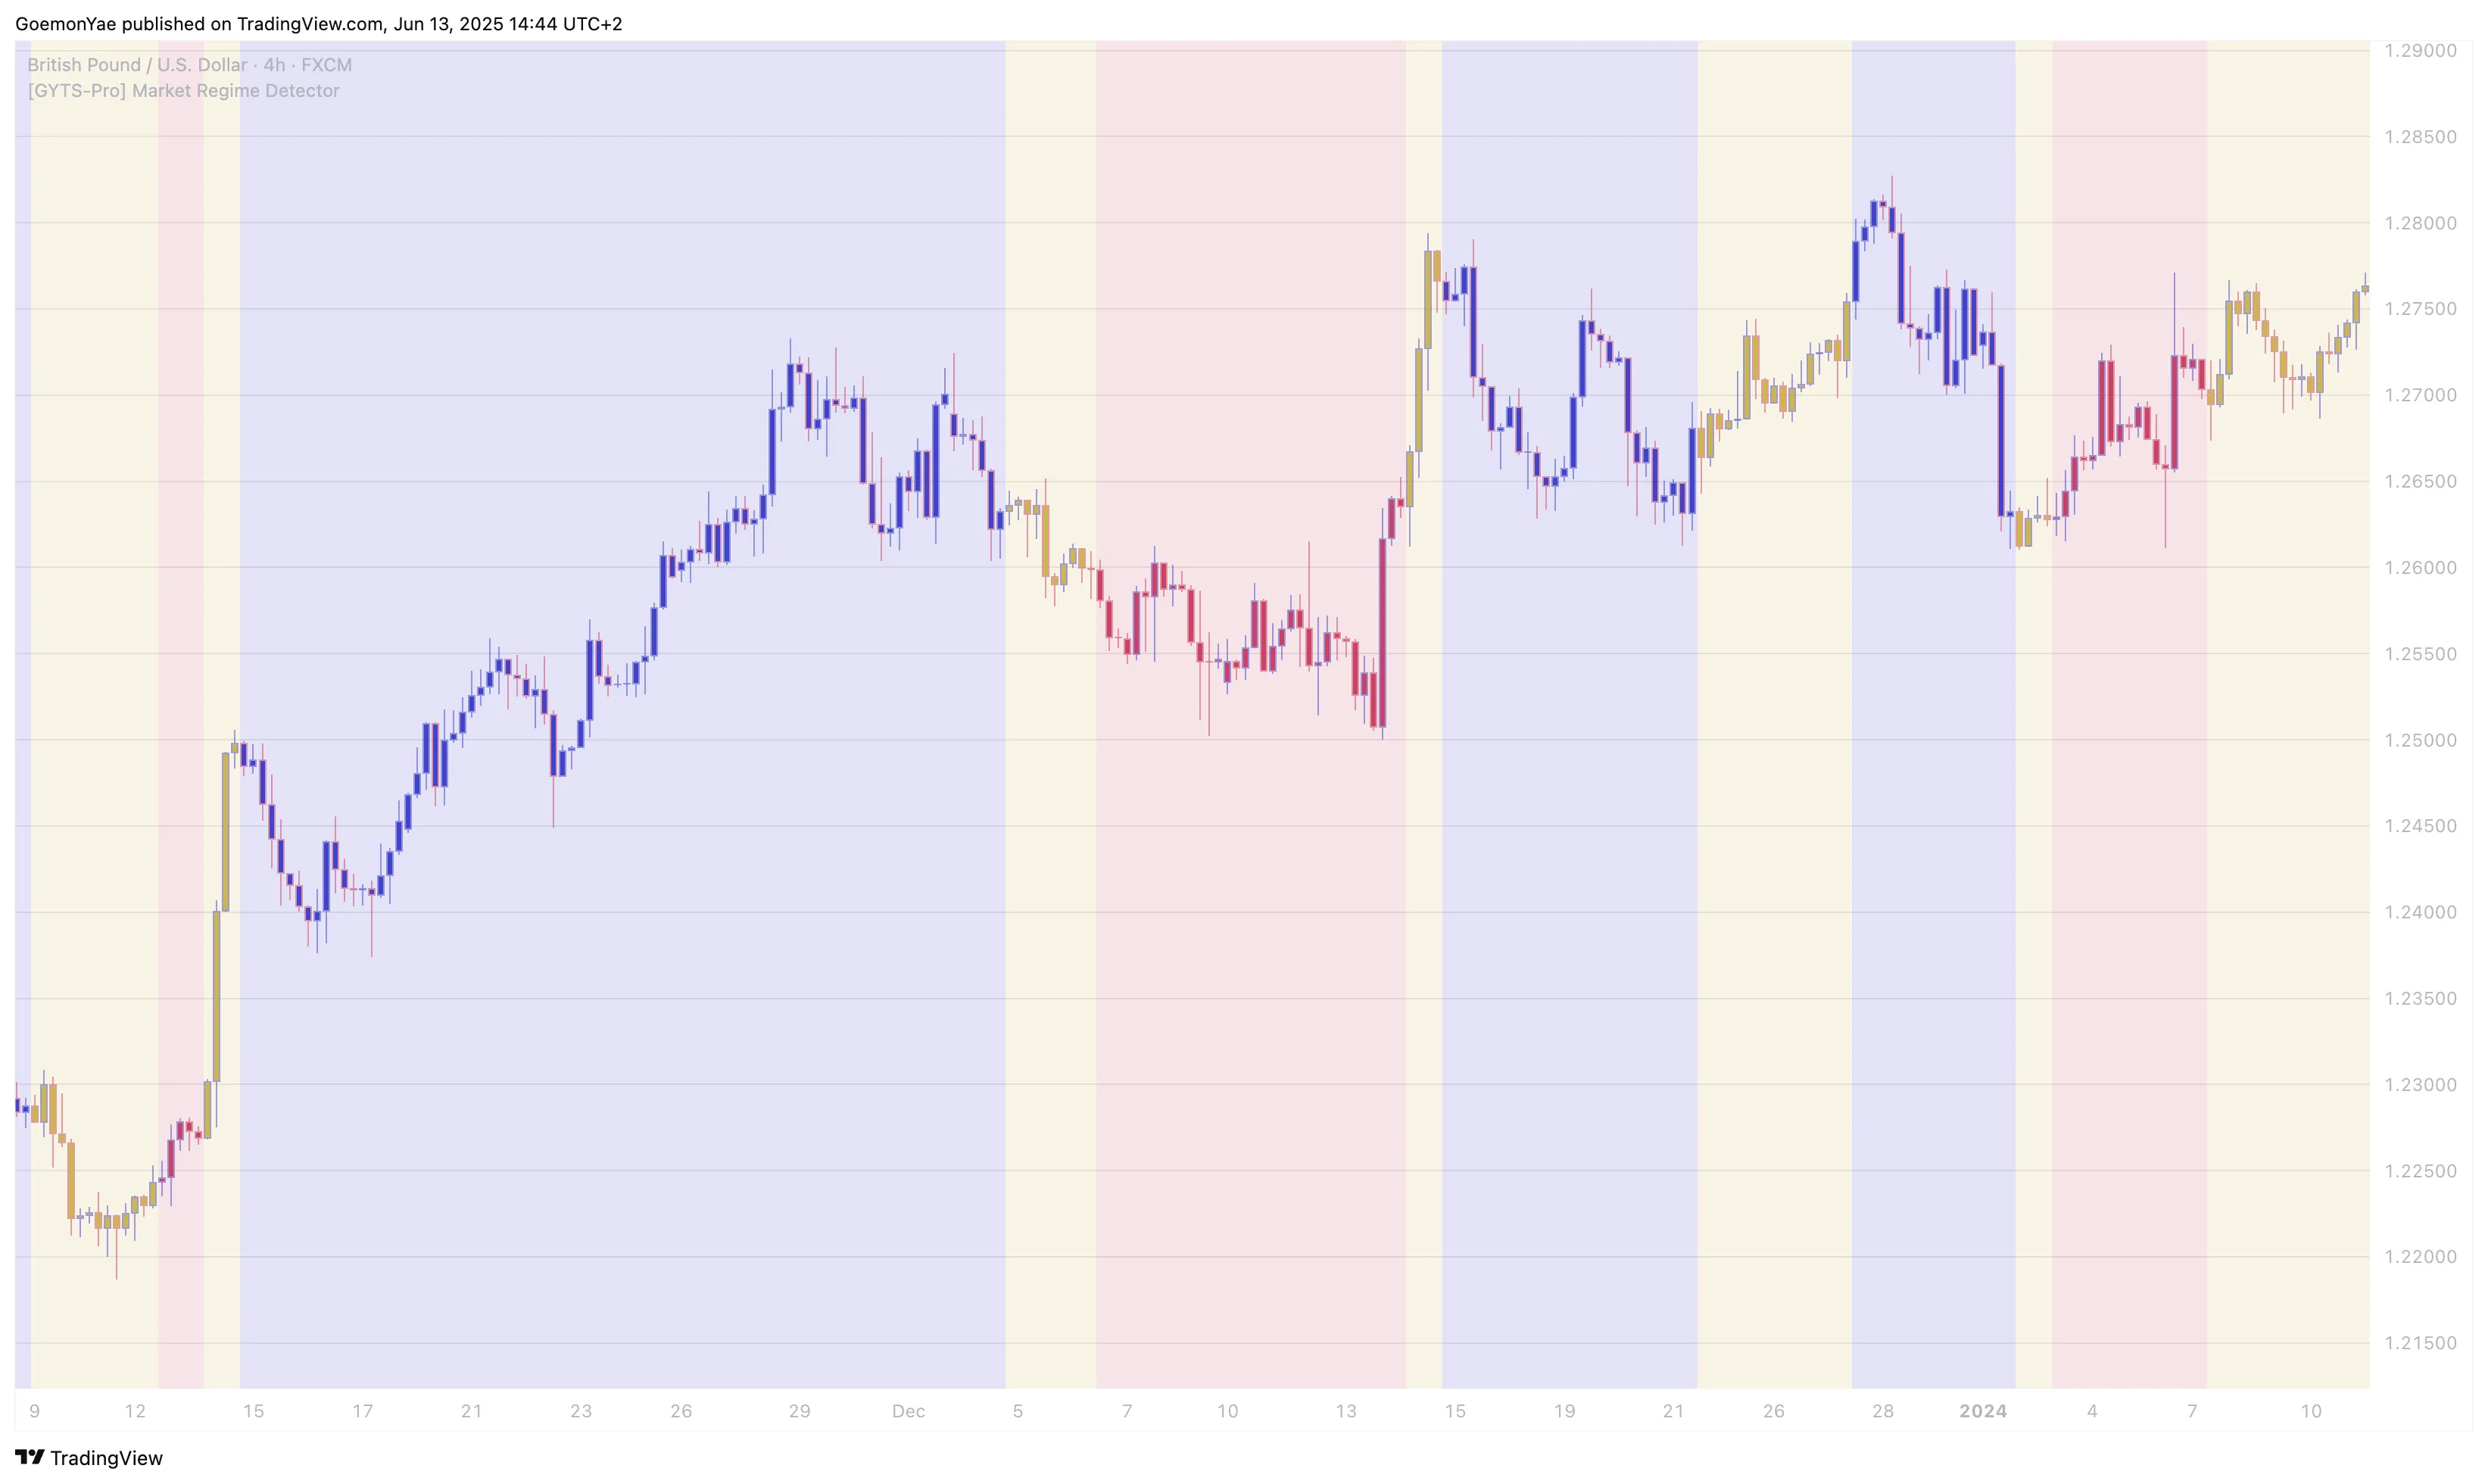
Analysis:
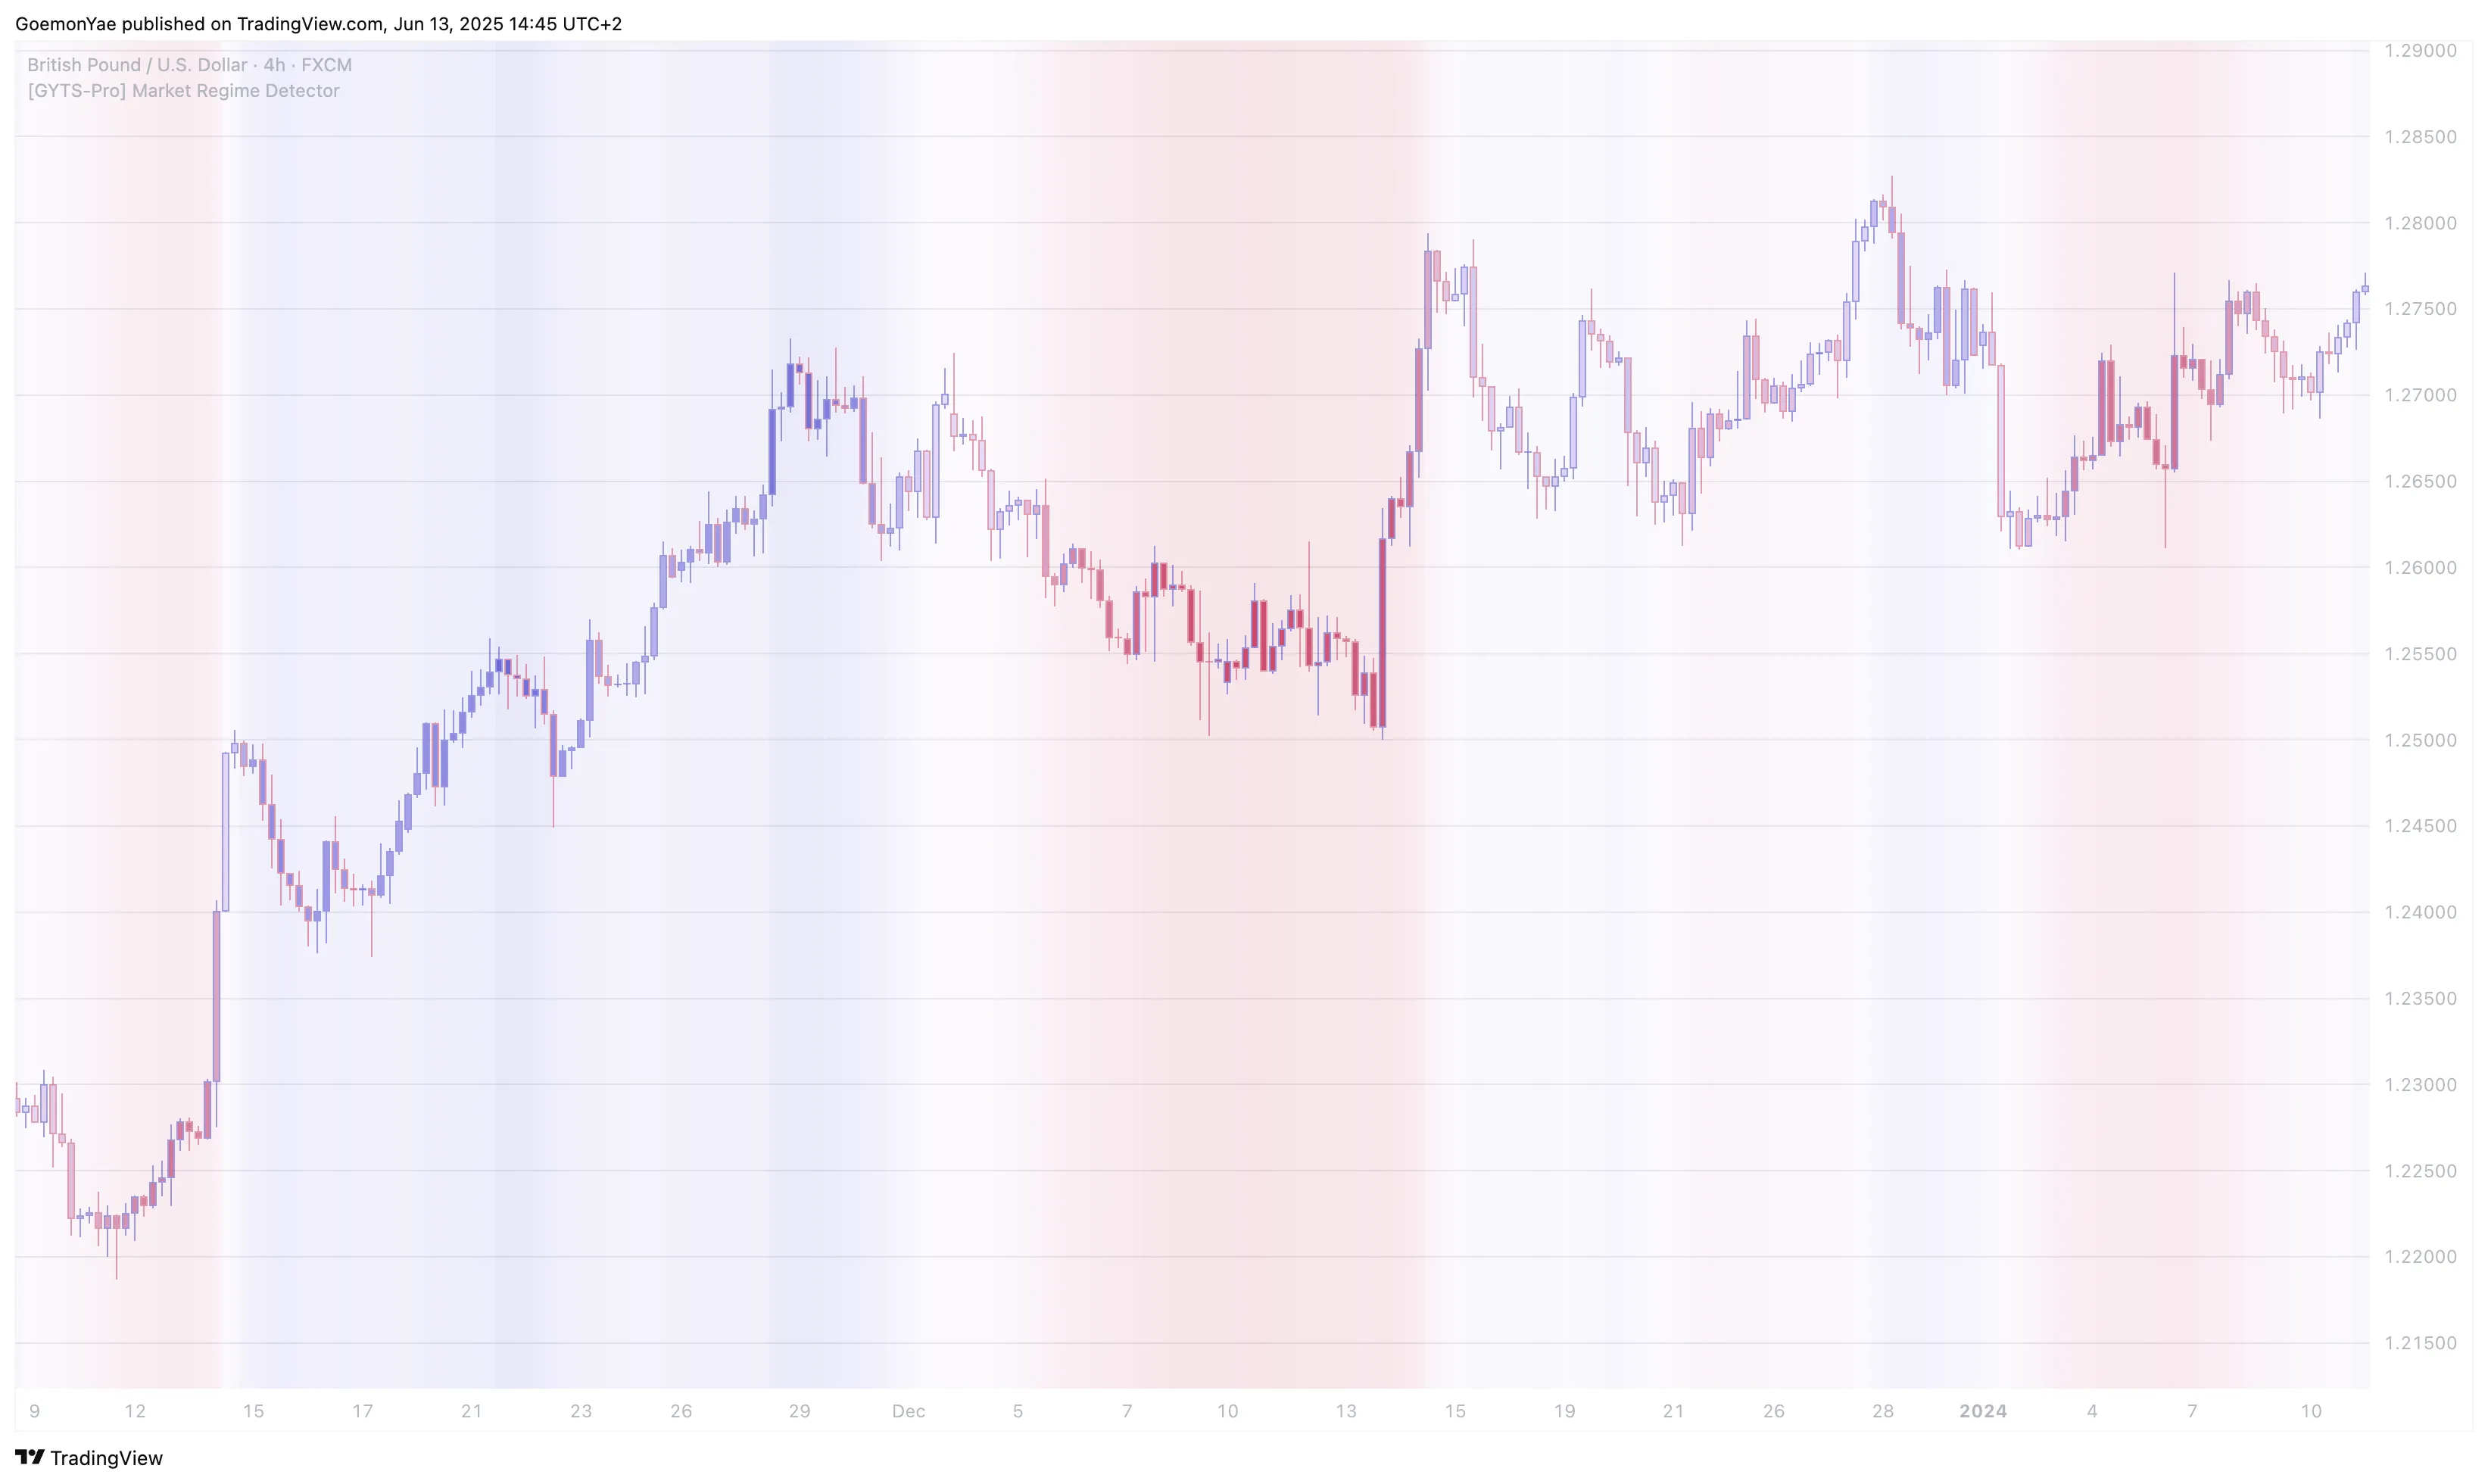
Analysis:
The unconstrained mode reveals granular market transitions through colour intensity—darker shades indicate stronger regime conviction whilst lighter tones suggest potential transitions.
Customise the visual representation to match your preferences or improve visibility. The colour system supports both discrete and gradient display modes.
Customisation Options:
The dominant cycle represents the market’s natural rhythm — the average period between successive peaks or troughs. This fundamental frequency drives all calculations within the detector.
Algo Apprentice — Static Cycle Input
Requires manual specification of the dominant cycle period:
Visual Observation
Starting Points by Market
Fine-Tuning Process
Goemon Warrior — Dynamic Adaptation
The Professional Edition uses proprietary algorithms to continuously identify and adapt to the dominant market cycle:
Key Advantages:
The system analyses market behaviour patterns to determine the natural rhythm without requiring manual cycle period input. This ensures your analysis always aligns with current market conditions rather than historical assumptions.
Volatile Market Settings
Crypto’s volatility requires responsive adaptation with conservative sensitivity to avoid whipsaws.
Stable Market Settings
Forex pairs benefit from balanced settings with slightly elevated sensitivity for cleaner trends.
Trending Market Settings
Indices favour stability with conservative consensus to capture sustained directional moves.
Tactical Adjustments:
Defensive Positioning:
Range-Trading Tactics:
| Feature | Algo Apprentice | Goemon Warrior |
|---|---|---|
| Detection Methods | ||
| Total Detection Methods | 2 | 5 |
| ML Tuning | ||
| Cyclic Centroid Analysis | ||
| Volatility Channel | ||
| Spectral Momentum | ||
| Energy Distribution Gauge | ||
| Phase Coherence Detector | ||
| Cycle Analysis Framework | ||
| Cycle Measurement | User-defined constant | Proprietary algorithm |
| Dominant Cycle Input | Manual | Automatic detection |
| Cycle Adaptation | Static period | Continuous adaptation |
| Consensus Mechanisms | ||
| Any Method (OR) | ||
| All Methods (AND) | ||
| Weighted Decision | ||
| Strength-Weighted Decision | ||
| Consensus Threshold Control | Fixed | Dynamic weighting |
| Performance & Accuracy | ||
| False Signal Rate | Moderate | Significantly lower |
| Detection Accuracy | Good (2 methods) | Superior (5 methods) |
| Regime Transition Smoothness | Standard | Enhanced |
| Cross-Market Generalisation | Limited | Enhanced |
Position Trading
Settings: Very Low adaptability, Low sensitivity, All Methods consensus
Focus on major regime shifts only. Let winners run in trending regimes, reduce exposure in cyclic periods.
Swing Trading
Settings: Low adaptability, Normal sensitivity, Weighted consensus
Balance stability with responsiveness. Use regime context for position sizing and stop placement.
Day Trading
Settings: High adaptability, High sensitivity, Any Method consensus
Quick regime recognition for intraday opportunities. Switch strategies based on current regime.
Multi-Timeframe
Settings: Use multiple instances with different parameters
Higher timeframe for bias, lower timeframe for timing. Ensure parameter consistency across timeframes.
Too Many Regime Changes
Delayed Regime Detection
Stuck in One Regime
No Background Colour
Gradient Not Showing
Colour Conflicts
Order Orchestrator Not Reading
Incorrect Regime Values
Performance Problems
“The market speaks in three tongues—trending up, trending down, or cycling in contemplation. The wise trader listens before acting, adapting strategy to the market’s voice rather than imposing will upon chaos.”