The Flux Composer orchestrates harmony from chaos — transforming multiple signal streams into unified trading intelligence. Drawing inspiration from ensemble learning in machine learning and signal processing theory, it weighs signal quality, recency, and agreement to reveal moments when market forces align.
The Flux Composer is the heart of our TradingView Suite:
Hover over components to see details. Lines indicate data flow between components.
The Flux Composer employs advanced temporal decay models to ensure recent signals carry appropriate weight, whilst sophisticated confluence mechanisms filter noise and amplify conviction.
Unlike traditional indicators that provide binary signals, the Flux Composer processes the quality and strength of signals over time. This continuous approach mirrors how skilled traders naturally process information — weighing recent developments more heavily whilst allowing older signals to gracefully fade.
The Flux Composer processes signals through five distinct stages:
Signal Provider generates continuous strength signals (e.g. GDM, QMC)
Decaying Functions apply mathematical decay models based on signal age and original strength
Flux Aggregation combines all decayed signals into raw flux values
Confluence Mechanisms transform raw flux using sophisticated mathematical processing
Trading Signals emerge as buy/sell triangles when thresholds are crossed
Each stage serves a specific purpose in transforming raw market data into actionable intelligence. Signal Providers contribute GDM and QMC streams, which undergo temporal weighting through intensity and decay controls. The aggregated flux then passes through one of four confluence mechanisms—from simple amplitude compression to our proprietary GYTSynthesis—before generating final trading signals.
Signal Providers: Other indicators, i.e. Signal Providers like WaveTrend 4D, generate continuous signal streams that feed into the Flux Composer.
Signal Processing: The Flux Composer applies intensity controls and decay rates to weight signal importance over time
Flux Aggregation: All processed signals are mathematically combined into unified flux values
Confluence Processing: Advanced mechanisms (like GYTSynthesis) transform raw flux for better signal discrimination
Threshold Processing: Compares flux values against configurable thresholds to determine when signals should trigger
Output Generation: Produces trading signals (buy/sell triangles) and output streams for e.g. Order Orchestrator integration
Here’s the comprehensive breakdown:
Signal Providers (External Indicators):
Up to four other indicators, i.e. Signal Providers like WaveTrend 4D, generate continuous signal streams that feed into the Flux Composer.
Decaying Functions:
Each signal from the streams passes through a customisable decay function that controls its initial strength (Intensity) and how quickly it fades over time (Decay Rate). The results are individual, continuous, decayed signals.
Signal Categorisation:
The decayed signals are categorised into one of two paths: the main ‘Signal’ path for generating trades, or the ‘Filter’ path for validating them (Professional Edition only).
Flux Aggregation:
All signals within a category are mathematically combined into a single raw ‘Flux’ value, representing the total bullish or bearish pressure.
Confluence Processing:
The raw flux undergoes a transformation using one of four mathematical mechanisms (e.g., Amplitude Compression, GYTSynthesis) to improve signal clarity and discrimination.
Threshold Processing:
The transformed flux value is compared against user-defined upper (bullish) and lower (bearish) thresholds.
Final Signal Generation:
A trading signal is generated when the Signal Flux crosses a threshold, provided it passes a validation check against the Filter Flux (if used).
Output Streams:
The Flux Composer generates multiple outputs: visual signals on the chart, alert conditions (though Order Orchestrator is recommended for advanced execution), and data streams for use by other indicators like the Order Orchestrator.
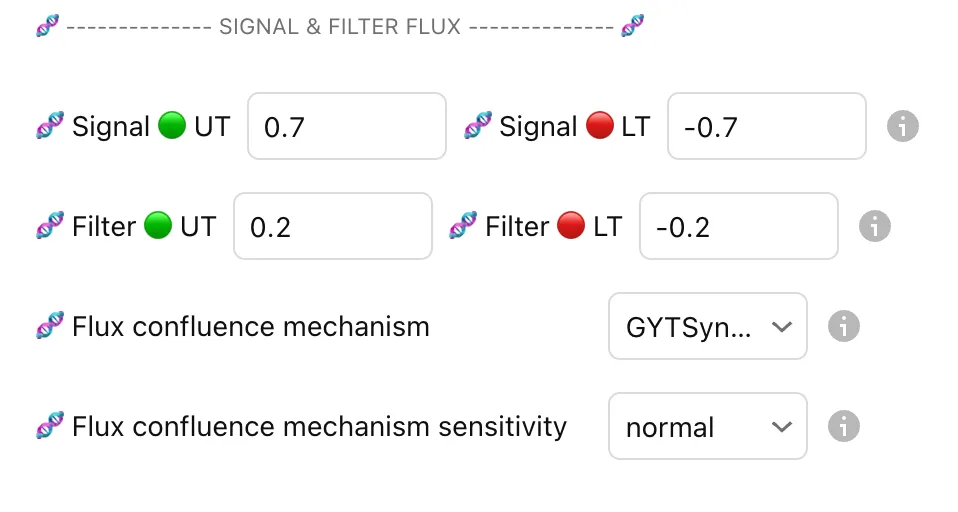
The primary output that generates trading signals when crossing upper (bullish) or lower (bearish) thresholds. This represents the core analytical consensus.
Filter Flux
⚔️Goemon WarriorProfessional Edition Only: Acts as a gatekeeper, allowing Signal Flux signals only when filter conditions are met. Provides additional layer of signal validation.
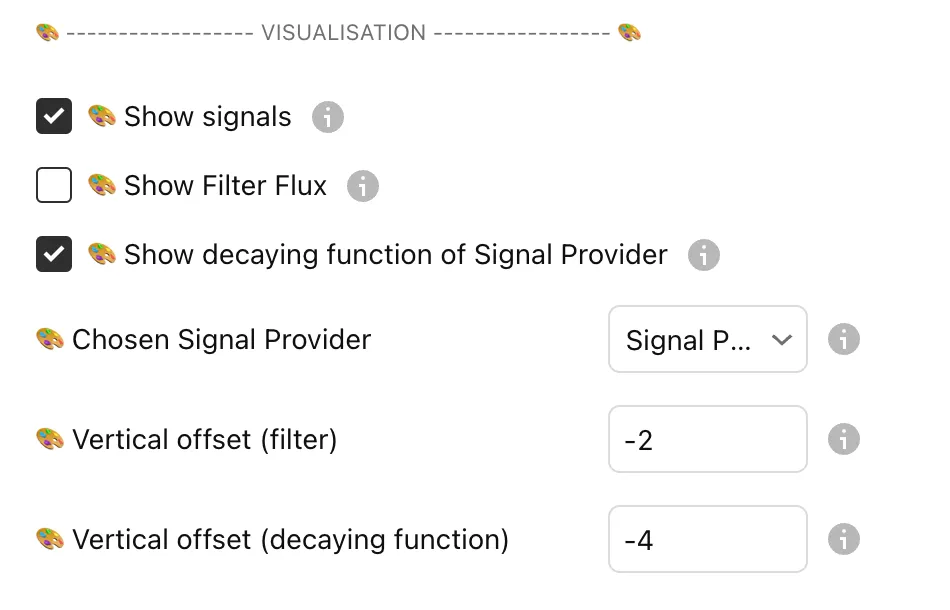
The brilliance of the Flux Composer lies in its treatment of signal relevance over time. Each signal undergoes transformation through our proprietary decay function , which you can visualise in real-time to understand and optimise your signal processing.
The Flux Composer's decaying functions account for the quality/strength of the input signal, instead of using simple buy/sell signals. In this example, both signals (the triangles in WaveTrend 4D) have the same settings in Flux Composer's decay functions. But you clearly see that the stronger signal (triangle farther away from zero) have a greater intensity.
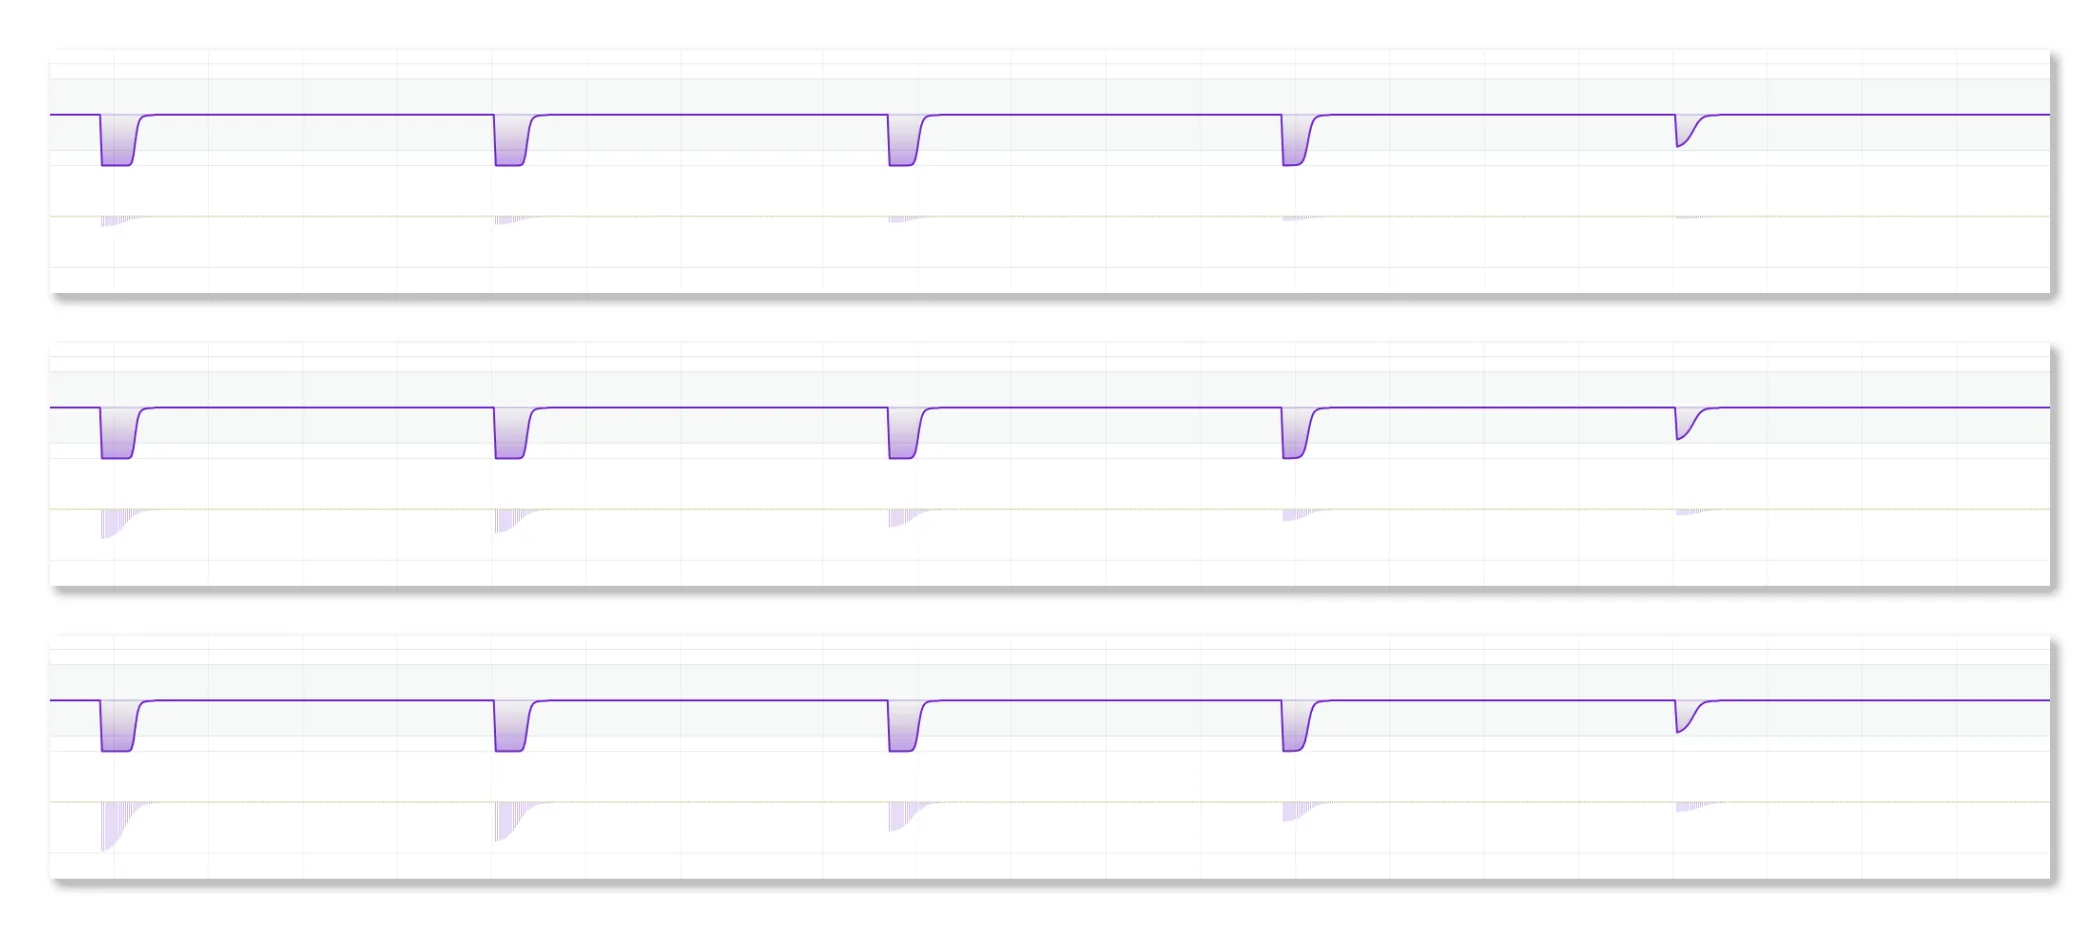
Intensity parameter comparison showing how different settings affect signal processing. From top to bottom: `intensity = very low`, `normal`, and `very high`. From left to right, the input signals that start with maximum strength and decrease in each time. Notice how higher intensity creates stronger, more pronounced decaying signal (the histogram) to the same input signals (thus when comparing vertically). All examples use normal decay rate with and `GYTSynthesis` confluence mechanism (notice how the Flux is the same when comparing vertically, due to its automatic normalisation).
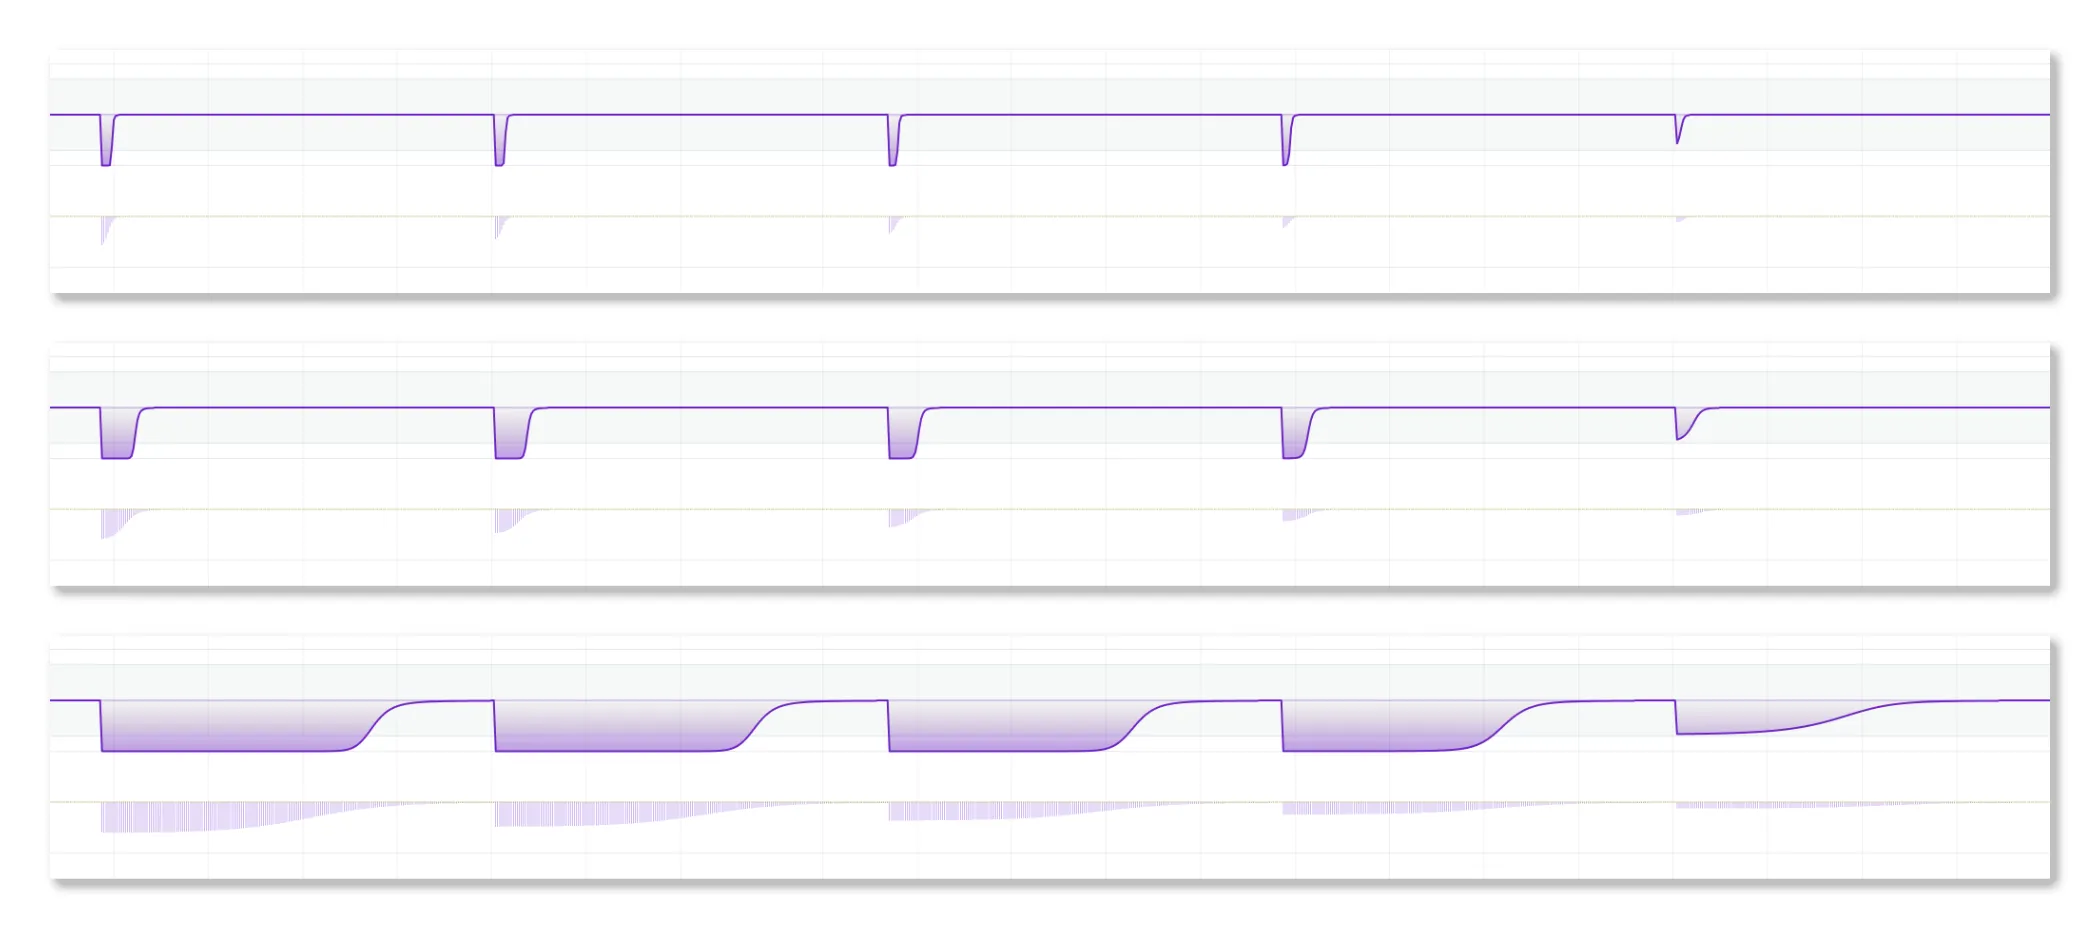
Decay rate parameter comparison demonstrating temporal persistence. We use the same input signals, from maximum strength to weak strength, as in the previous example. But now, fixating `intensity = normal`, we change from top to bottom `decay rate = very fast`, `normal`, and `very slow`. Observe how slower decay rates maintain signal influence over extended periods, whilst faster decay creates more responsive but shorter-lived signals.
The Flux Composer offers four sophisticated methods for processing aggregated signals:
Amplitude Compression
Similar to the Stochastic Oscillator methodology, this mechanism scales flux based on recent value ranges. Excellent for normalised comparisons but requires sufficient historical data.
Accentuated Amplitude
⚔️Goemon Warrior An enhanced version of the “Amplitude Compression” that emphasises strong flux values, providing superior discriminative power for high-conviction signals.
Trigonometric
Uses mathematical smoothing functions to reduce outlier impact whilst maintaining responsiveness. Works immediately without historical requirements.
GYTSynthesis
Our proprietary mechanism balancing signal strength with discriminative power . Designed for optimal tuning ease and cross-market generalisation.
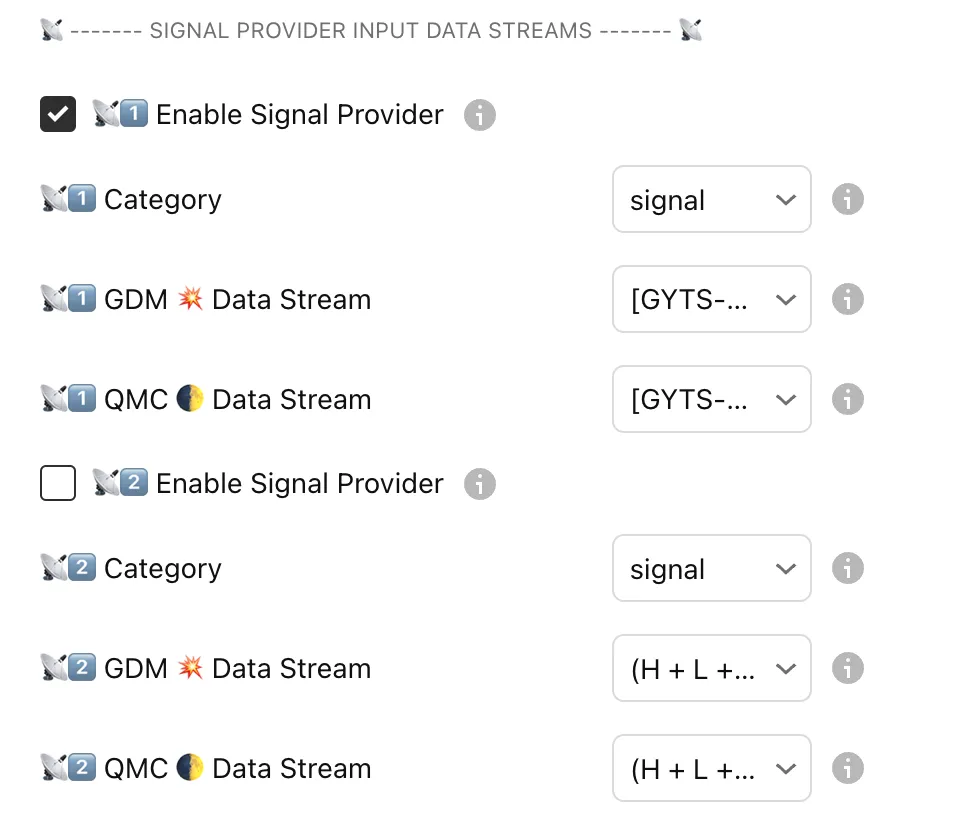
Input Data Streams Settings: Connecting with the Signal Providers and setting signal category
This section manages the connection between Signal Providers (like WaveTrend 4D) and the Flux Composer:
Enable Signal Provider
Activates or deactivates each Signal Provider slot
Up to 4 providers in Professional Edition
Each provider can be independently controlled
Category Selection
Signal: Contributes to the main Signal Flux for trade generation
Filter: ⚔️Goemon Warrior Acts as a gatekeeper for Signal Flux outputs
The filtering technique is great for dual-layer validation strategies. However, using the full GYTS TV Suite, the Market Regime Detector provides arguably superior filtering capabilities.
GDM & QMC Data Streams
Connect to the respective output streams from your Signal Providers (see also the Stream Configuration above)
Each provider outputs both GDM and QMC signals
Ensure correct stream selection when using multiple providers
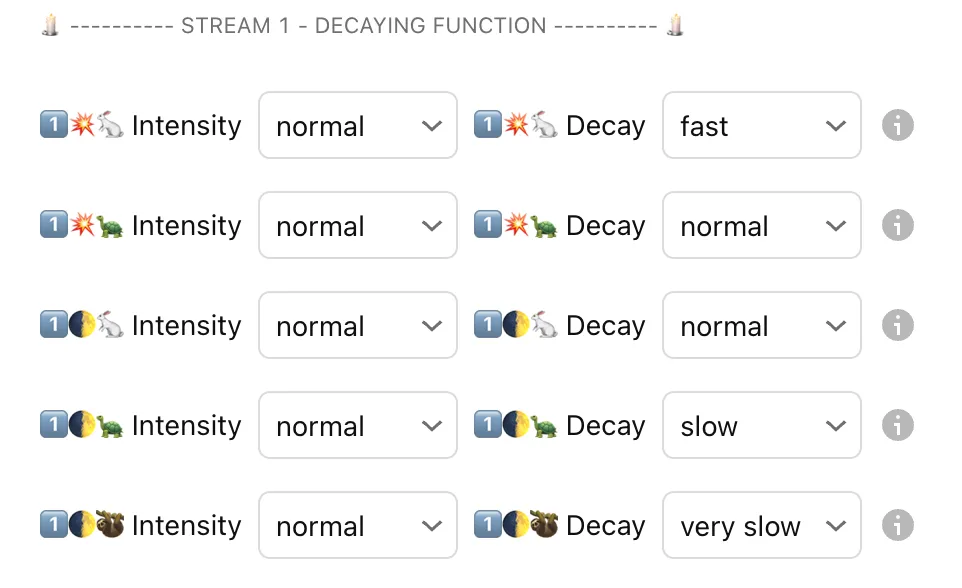
Each decaying function consists of intensity and decay rate
Each Signal Provider has dedicated decay controls for its constituent signals:
Signal Components
💥 GDM Signals: Gradient Divergence Measures
🐇 Normal: GDM signals with the Normal frequency as the baseline
🐢 Slow: GDM signals with the Slow frequency as the baseline
🌓 QMC Signals: Quantile Median Crosses
🐇 Normal: QMC signals based on the Normal frequency
🐢 Slow: QMC signals based on the Slow frequency
🦥 Lethargic: QMC signals based on the Lethargic frequency
Intensity Control
Disable: Turns off this specific signal
Very Low: Minimal contribution to flux
Low: Reduced influence
Normal: Standard weighting
High: Enhanced contribution
Very High: Maximum signal strength
Decay Rate Control
Very Fast: Signals fade within 5-10 bars
Fast: Signals persist for 10-20 bars
Normal: Balanced decay over 20-40 bars
Slow: Extended influence for 40-80 bars
Very Slow: Long-term persistence 80-160 bars
Lethargic: Ultra-slow decay beyond 160 bars
Subsquently, the actual Flux is calculated as the sum of all decayed signals, which are then processed through the confluence mechanisms. See details below.
The Flux Composer leverages sophisticated mathematical transformations to process market signals, utilising multiple functions from our open-source MathTransform library. This approach ensures robust signal processing across diverse market conditions.
What to Expect from Flux Processing:
Smooth Signal Aggregation: Multiple signals are mathematically combined to reduce noise and enhance clarity
Adaptive Weighting: Recent signals naturally carry more influence than older ones through temporal decay models
Dynamic Range Normalisation: Confluence mechanisms ensure signals remain within optimal ranges regardless of market volatility
Multi-layered Validation: Professional Edition’s filter flux provides an additional validation layer for higher-confidence trades
Each confluence mechanism transforms raw flux values to optimise signal clarity:
Amplitude Compression Results
Normalises flux values based on recent historical ranges, similar to how the Stochastic Oscillator bounds values between 0-100. Expect consistent signal strength regardless of market volatility changes.
Accentuated Amplitude Results
⚔️Goemon Warrior
Enhances strong signals whilst suppressing weak ones through specifically tuned power transformation. Expect clearer distinction between high and low conviction signals.
Trigonometric Results
Applies smooth mathematical curves to reduce outlier impact. Expect immediate signal processing without needing historical data accumulation, ideal for new instruments or timeframes.
GYTSynthesis Results
Our proprietary method balances multiple mathematical transformations from the MathTransform library. Expect optimal signal discrimination with minimal parameter tuning required.
The Flux Composer serves as the central nervous system of the GYTS TradingView suite, orchestrating signals from multiple providers into coherent, actionable intelligence. Like a master conductor interpreting various instruments to create symphonic harmony, it transforms cacophonous market data into clear trading signals.
Effective confluence analysis with the Flux Composer can be already achieved with just one Signal Provider, as e.g. the WaveTrend 4D Signal Provider can return op to 5 signals simultaneously. In fact, just using a single Signal Provider is the recommended starting point for new users. This allows you to develop a “feeling” for how the Flux Composer aggregates the signals, including the decaying functions and confluence mechanisms.
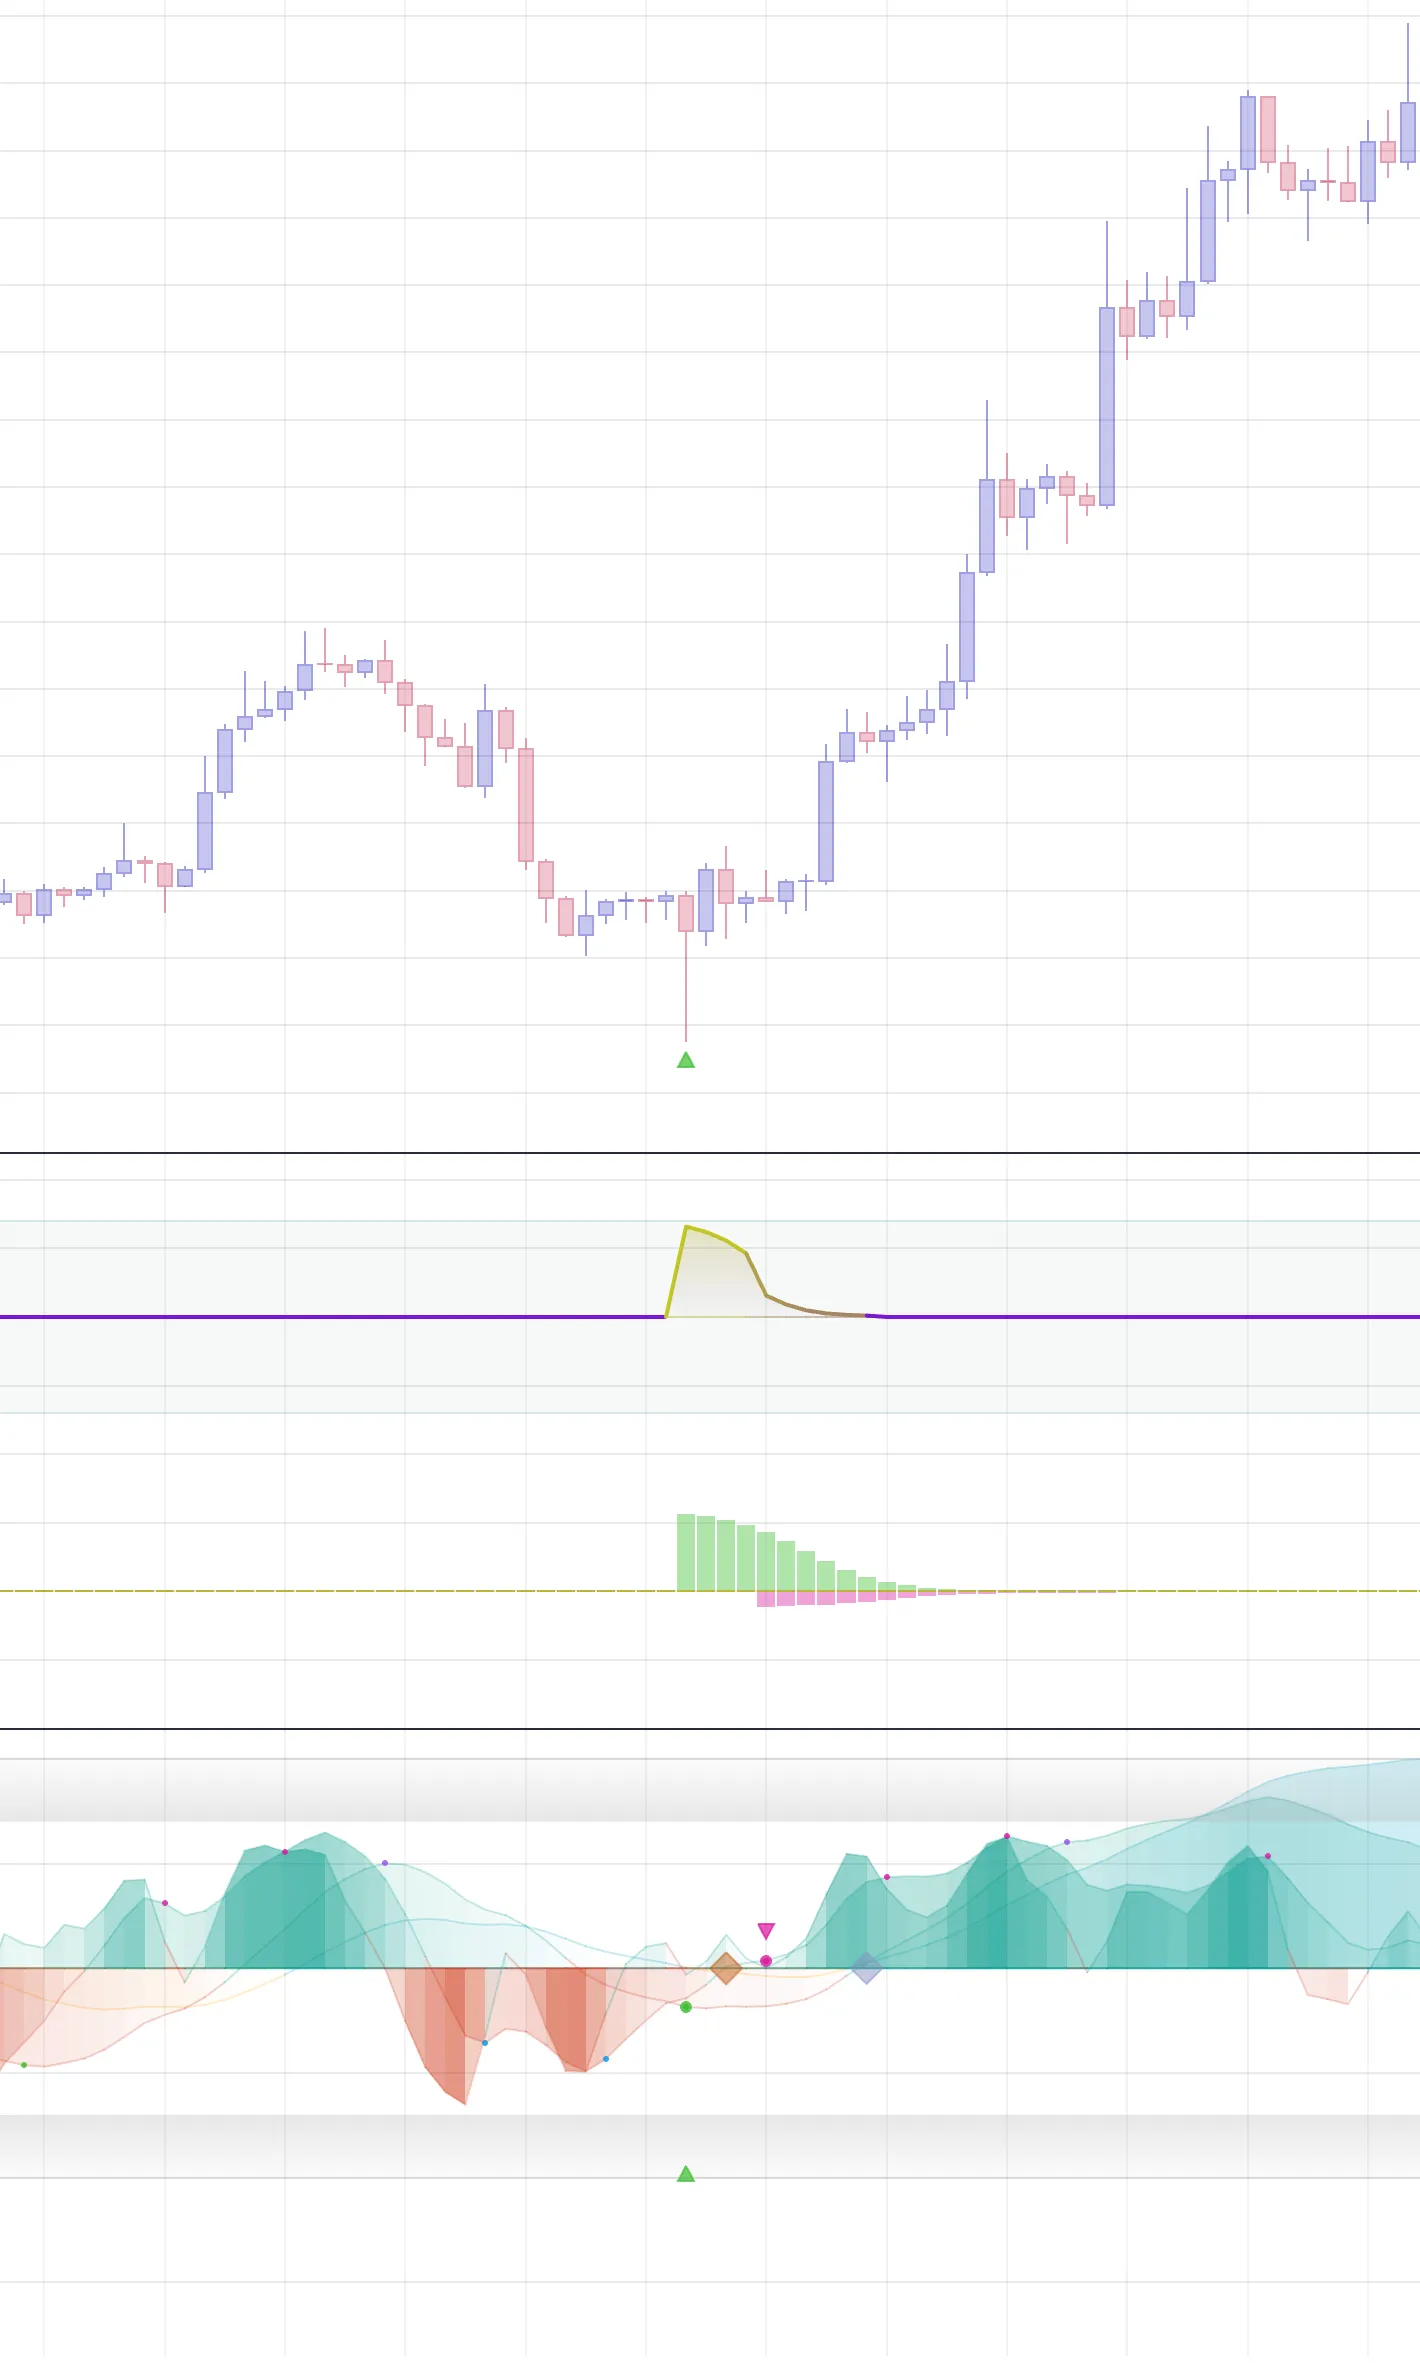
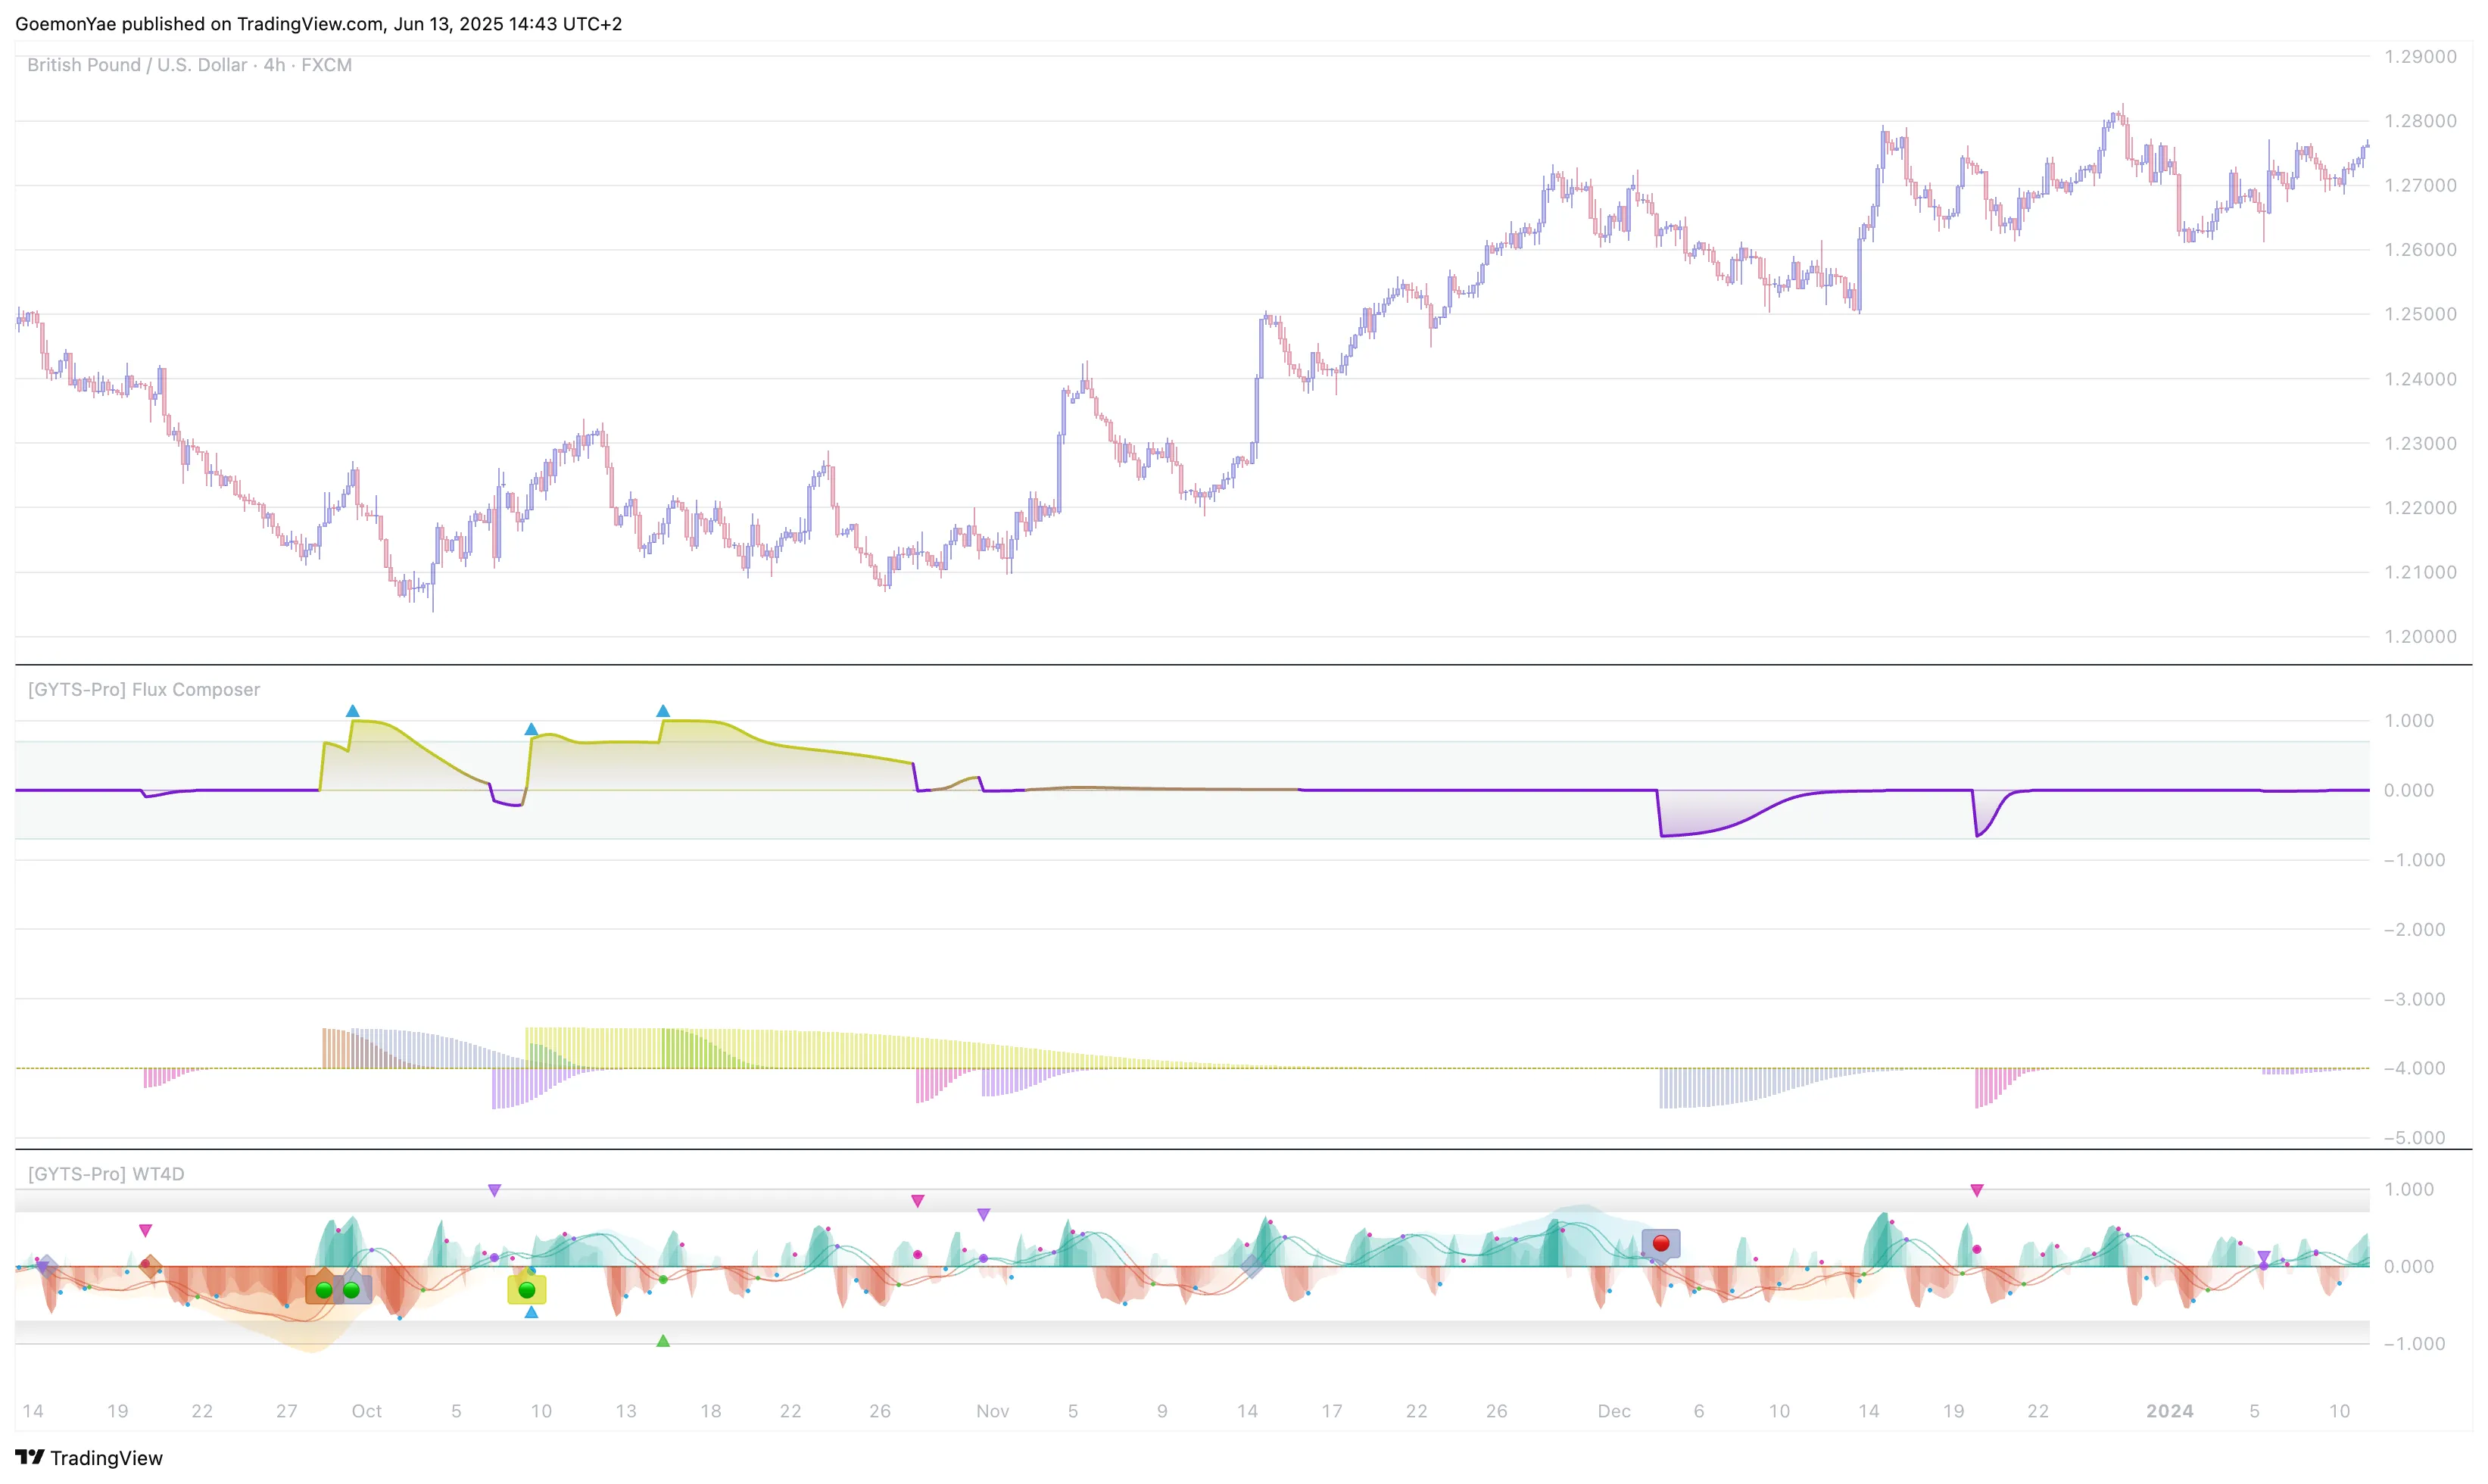
Example 1: British Pound / US Dollar Confluence Analysis
British Pound / US Dollar forex pair demonstrating processing multiple signals from a single Signal Provider on 4-hour timeframe. Note how contradictory signals are naturally cancelled out, whilst a single signal is in no case deemed 'significant', i.e. the Flux does not exceed the threshold (and no triangle appears).
Setup Configuration:
“Primary”: Main GBPUSD chart analysis using standard parameters
Signal Event: The Flux Composer identified a strong bearish confluence when multiple QMC and GDM signals aligned within a short time period. This multi-signal agreement provided high conviction for the short trade setup, demonstrating how diverse signal sources create robust trading opportunities in major currency pairs.
The previous example is a good introduction how to handle multiple signals. However, the true power of the Flux Composer emerges when multiple Signal Providers align to create high-conviction signals from multiple sources. Here are two practical examples demonstrating sophisticated multi-provider setups:
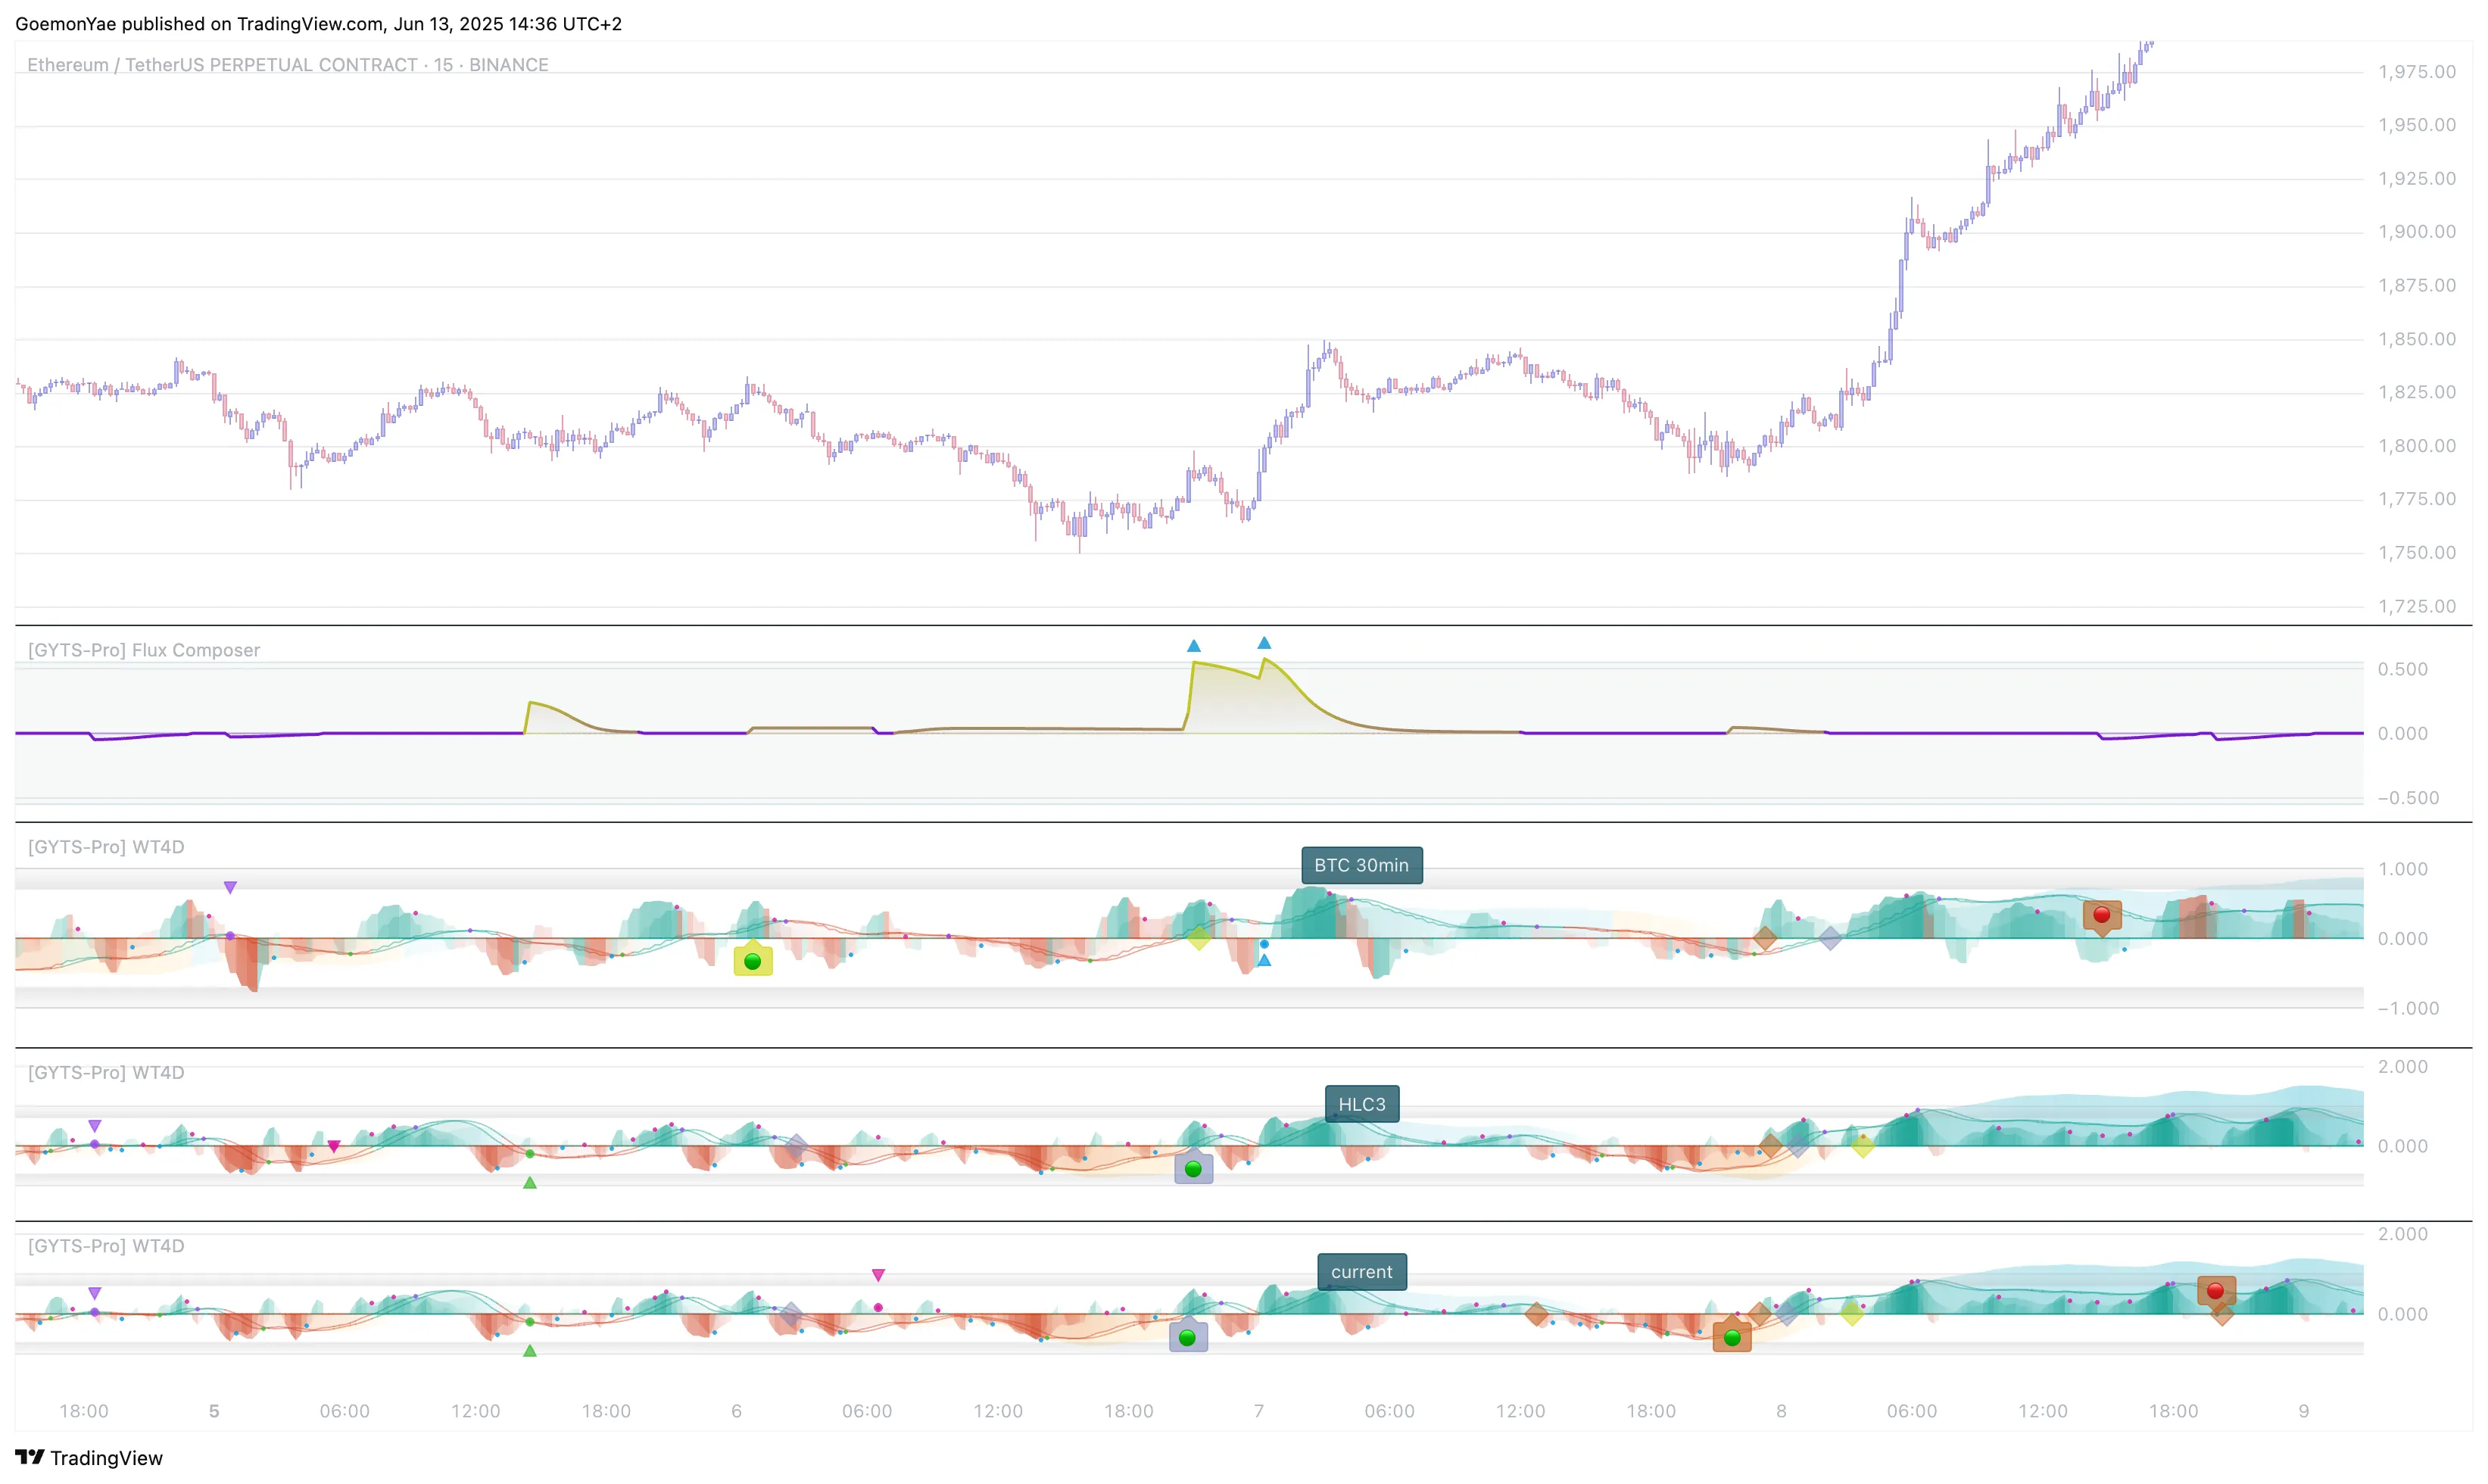
Example 2: Ethereum Perpetual Multi-Signal Confluence
Ethereum/USDT Perpetual on Binance, 15-minute timeframe
Setup Configuration:
“BTC 30min”: Bitcoin 30-minute trend as crypto market context
“current”: Primary Ethereum chart analysis
“HLC3”: Alternative price calculation for validation
Signal Event: A powerful long signal emerged when both QMC and GDM signals aligned across multiple providers. This combination of quantile median crosses and gradient divergence measures from different analytical angles created a robust bullish entry opportunity.
Apple Inc. NASDAQ, 4-hour timeframe with three WaveTrend 4D providers. The Flux Composer generates a confident short signal when two QMC signals from different sources align within a short window.
Setup Configuration:
“SPX daily”: S&P 500 daily trend as general market context
“HLC3”: Alternative price source for reduced noise
“current”: Primary chart analysis on close price
Signal Event: The Flux Composer generated a confident short signal when when sufficient strong signals occurred within a short time period and across Signal Providers.. This confluence of signals from multiple analytical perspectives provided high conviction for the bearish trade setup. Notice also how the other signals, even when significant (e.g. the GDM signals are all very strong), do not affect the Flux much. This setup really requires confluence from multiple signals.